Explore Open Rooms

1 Contact details
2 What type of senior care service are you looking for?
3 What budget do you have in mind for senior care?
4 How soon do you need to find care?
5 Additional details

Thank you for your interest!

Our team will be in touch shortly to help with next steps.

Nursing Home in Los Angeles

CMS overall rating Info The Overall CMS Rating combines results from health inspections, staffing levels and quality measures. Health inspections carry the most weight. Staffing and quality scores can increase or decrease the final rating based on performance compared to state and national standards.

Lighthouse Healthcare Center

2222 Santa Ana Blvd S, Los Angeles, CA 90059 View map
Overview of Lighthouse Healthcare Center

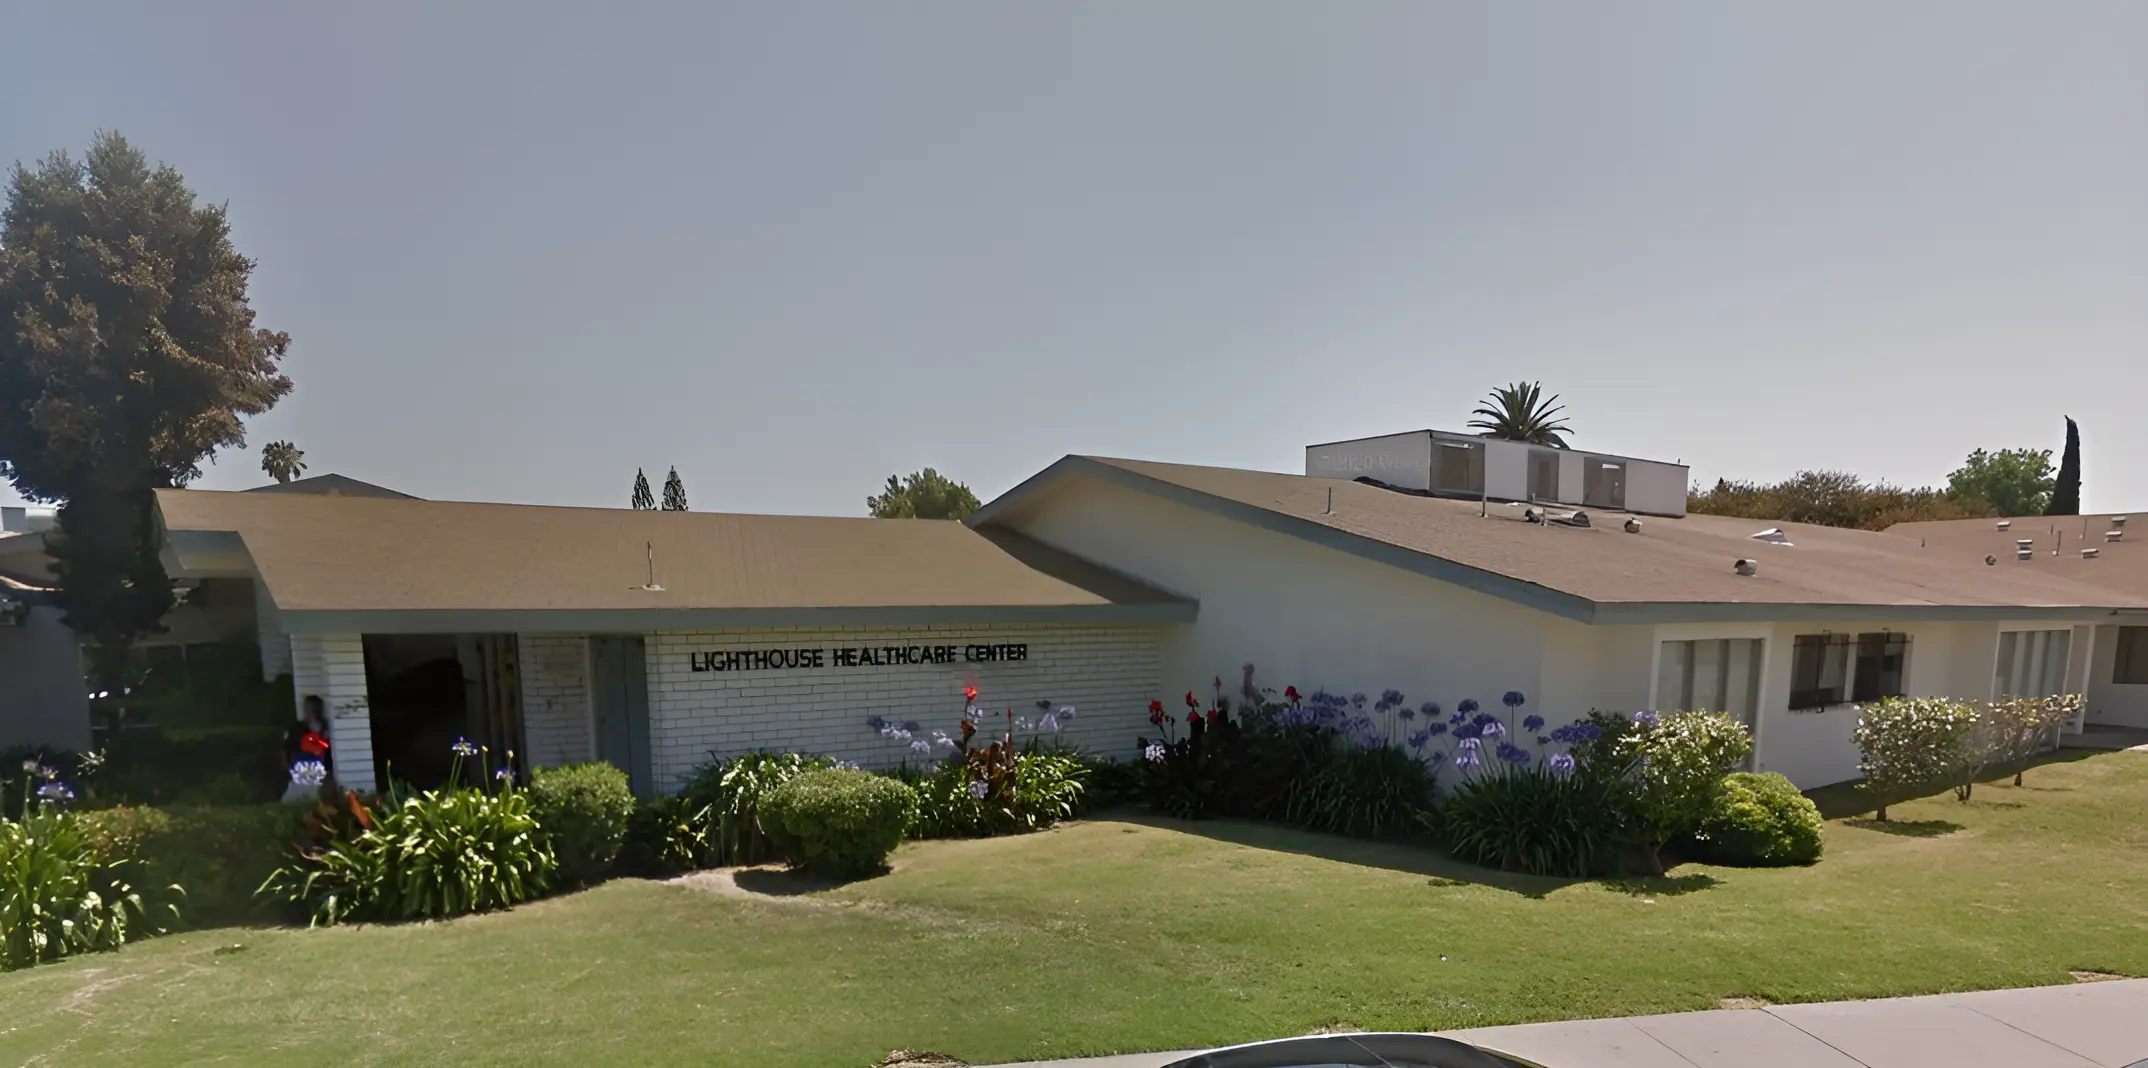
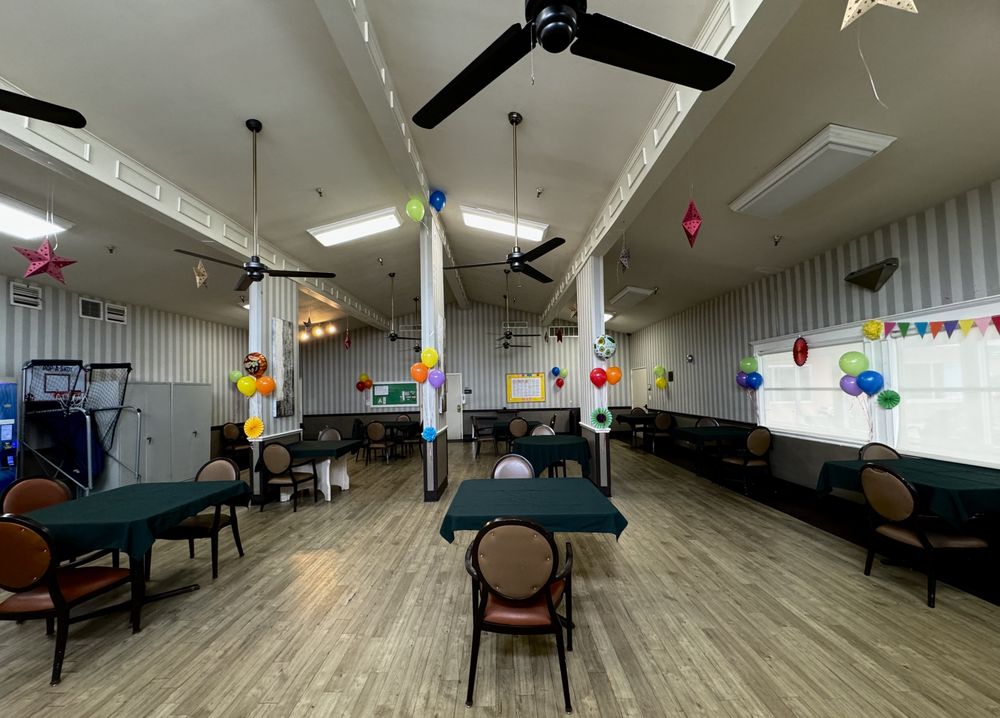
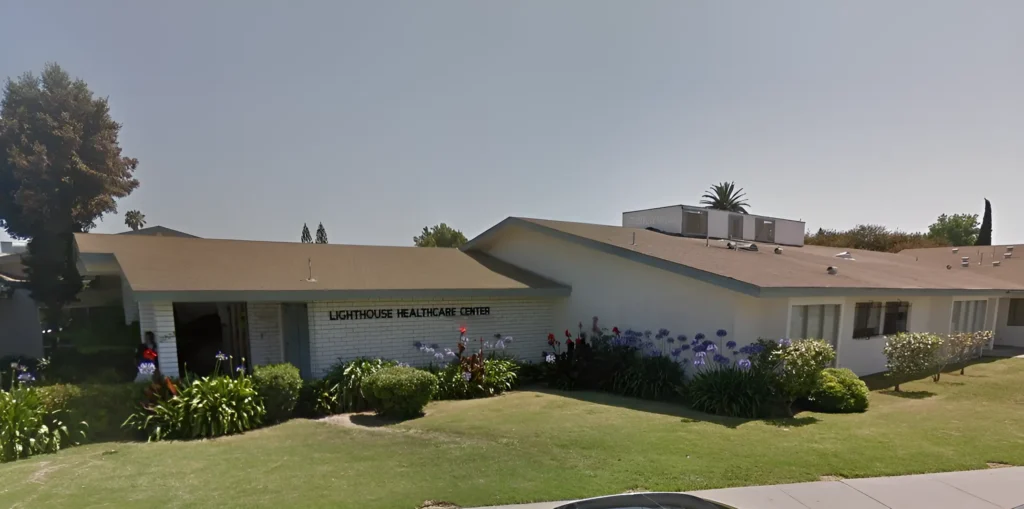
Seek exceptional care at Lighthouse Healthcare Center, an astounding community in Los Angeles, CA, offering skilled nursing and rehabilitation. Residents can ease their worries with a compassionate and well-trained team attending to their needs around the clock. The community also accepts Medicare and Medicaid, striving to ease financial burdens.

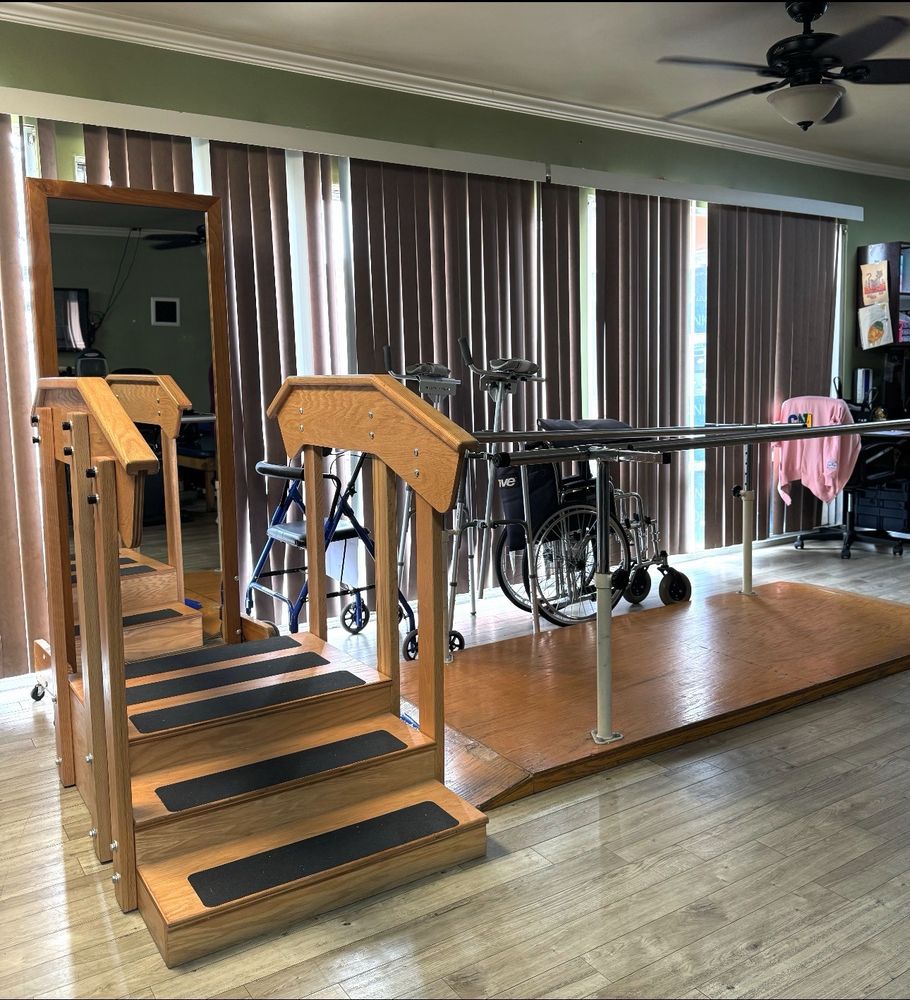
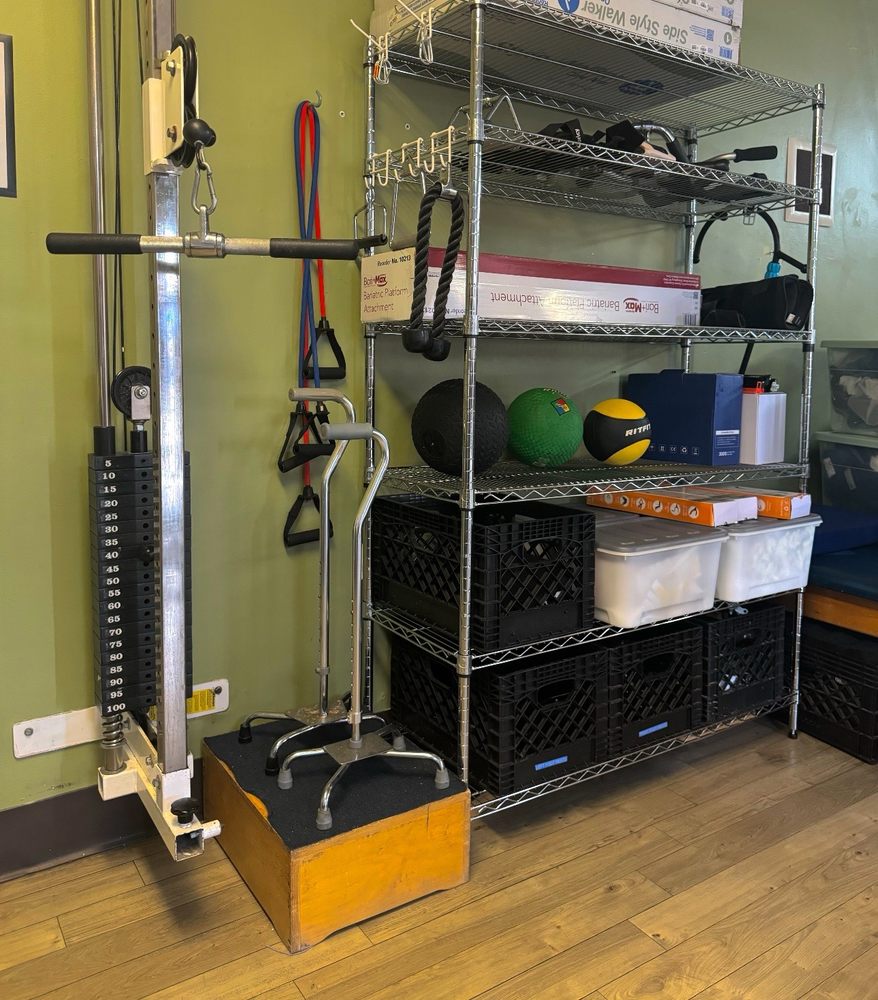
Fun recreational activities and stimulating programs are conducted to keep residents active and socially connected. Delicious and healthy dining options are served to meet residents’ dietary needs and preferences. Individualized therapy programs are also provided to enhance residents’ living experiences. With its comprehensive care options and top-tier amenities, residents are guaranteed the finest retirement experience.

(213) 204-4725

Quality ratings

Measured by Centers for Medicare & Medicaid Services (CMS)

Overall rating Info The Overall CMS Rating combines results from health inspections, staffing levels and quality measures. Health inspections carry the most weight. Staffing and quality scores can increase or decrease the final rating based on performance compared to state and national standards.
2/5
California average: 3.6/5
Health Inspection Info Based on the results of the facility's three most recent standard inspections and any complaint investigations. CMS reviews the number, scope, and severity of deficiencies, with more recent findings weighted more heavily.
2/5
California average: 3.2/5
Staffing Info Measures average nursing staff hours per resident per day, including Registered Nurses (RNs) and total nursing staff. Ratings are adjusted based on the level of care residents require and are compared to state and national benchmarks.
4/5
California average: 3.5/5
Quality Measures Info Based on clinical and physical health indicators reported to CMS, such as hospital readmissions, falls, pressure ulcers, and improvements in mobility. These measures reflect how well residents' health needs are being managed.
4/5
California average: 4.3/5

Nursing care per resident

Info This shows how many total hours of nursing staff time are available per resident each day. Higher numbers usually mean more staff support.
4h 44m per day

This home provides 8% more nursing time per resident than the California average.

California average: 4h 23m per day

Staffing hours breakdown

Info Hours of care per resident per day, broken down by staff type. Data from CMS Medicare.
Staff type Facility State avg National avg
Registered Nurse (RN) Info Registered nurse hours per resident per day. 17m per day 39m per day 41m per day
Nurse Aide Info Nurse aide hours per resident per day. 3h 31m per day 2h 39m per day 2h 21m per day
Total Nursing (Weekend) Info Total number of nurse staff hours per resident per day on weekends. 4h 0m per day 4h 5m per day 3h 26m per day
Physical Therapist Info Physical therapist staff hours per resident per day. 3m per day 5m per day 4m per day
RN (Weekend) Info Registered nurse hours per resident per day on weekends. 12m per day 30m per day 29m per day

Capacity and availability

Smaller home

May offer a more intimate, personalized care environment.

Total beds 49

This home usually has availability

Lower occupancy suggests more openings may be available.

Lower demand than the California average
Occupancy rate 75.6%
Residents per day (avg) 125
Occupancy rate
75.6%
Residents per day (avg)
125

Who this home usually serves

TYPE OF STAY

Mostly short-term rehab stays

Most residents typically stay for a few weeks or months before returning home or moving on.

Might be optimal for
Short stays Recovery Medicare-covered care

Breakdown by payment type

Medicare

61% of new residents, usually for short-term rehab.

Typical stay 2 - 3 months

Private pay

4% of new residents, often for short stays.

Typical stay 11 - 12 months

Medicaid

36% of new residents, often for long-term daily care.

Typical stay 1 - 2 years

Finances and operations

Privately-owned community
Home revenue
$16.3M
Profit
$2.3M
Privately-owned community
Home revenue
$16,264,417.00
Profit
$2,258,960.00
Payroll costs Info The portion of the home's budget spent on staff, including nurses, caregivers, and other employees who support care and operations.
$7.8M
48.2% of revenue
Other operating costs Info All remaining costs needed to run the home, such as food, utilities, building maintenance, supplies and administrative expenses.
$6.2M
Total costs $14.0M
Bed community size
49-bed community
A moderately sized community that may balance personal attention with shared amenities and social activities.
Walk Score
Walk Score: 69 / 100
Moderately walkable. Some errands can be accomplished on foot, with a mix of nearby amenities.

About this community

Occupancy

Occupancy rate
49%
33% lower than California average

California average: 73%

Occupied beds
24 / 49
Average residents 87 per day

License details

County: LOS ANGELES

What does this home offer?

Housing options icon

Housing Options: Semi-Private / Shared Rooms

Building type icon
Building type icon

Building Type: Single-story

On-site medical care and health services icon

On-site Medical Care and Health Services

Types of Care at Lighthouse Healthcare Center

Nursing Home
Contact Lighthouse Healthcare Center

Inspection History

In California, the Department of Social Services (for assisted living facilities) and the Department of Public Health (for nursing homes) conduct inspections to ensure resident safety and regulatory compliance.

4 visits

California average: 16 visits

Breakdown by visit type

3 total complaint visits

1 other visit Info Other visits include regulatory visits that are not routine inspections or complaint investigations, such as administrative check-ins, follow-up reviews, or licensing-related visits.

California average

13 total complaint visits

7 other visits

3 complaint investigations Info Inspections conducted in response to complaints filed by residents, families, staff, or others about possible problems at the facility.

Investigations can have many visits.

California average: 10 complaint investigations

5 official inspections Info Routine inspections conducted by state regulators to evaluate whether the facility meets federal and state care and safety standards.

California average: 4 official inspections

1 total citation

Citations indicate regulatory violations. A higher number implies the facility had several areas requiring improvement.

California average: 10 citations

1 serious citation

A violation that poses an immediate risk to resident health or safety, or represents a substantial failure to comply with licensing requirements.

California average: 3 serious citations

0 moderate citations

A violation that does not pose an immediate risk to resident health or safety but requires correction to remain in compliance.

California average: 4 moderate citations

Health Inspection History

Inspections
Total health inspections 13

California average 12.5


Last Health inspection on Jun 2025

Total health citations 71

California average 50.2

Citations per inspection
5.46

California average 4.65


Health citations are formal notices following inspections when they fail to comply with safety and care standards.

53 of 71 citations resulted from standard inspections; 16 of 71 resulted from complaint investigations; and 2 of 71 came from combined inspections (standard and complaint).

Breakdown of citation severity (last 3 years)
Critical Health citations More info 0
100% better than California average

California average: 0.4


Serious Health citations More info 2
100% worse than California average

California average: 1

0 critical citations More info California average: 0.4

2 serious citations More info California average: 1

69 moderate citations More info California average: 47.2

0 minor citations More info California average: 1.5
Citations history (last 3 years)
Environmental moderate citation Info Issues related to building safety, cleanliness, maintenance, and overall living conditions. Jun 05, 2025
Corrected

Infection Control moderate citation Info Issues related to preventing and controlling infections, including hygiene practices and safety protocols. Jun 05, 2025
Corrected

Nursing Services moderate citation Info Issues related to the availability and quality of nursing staff and the care they provide. Jun 05, 2025
Corrected

Nutrition moderate citation Info Issues related to food quality, meal service, and resident's nutritional needs. Jun 05, 2025
Corrected

Compare Nursing Homes around Los Angeles The information below is reported by the California Department of Social Services and Department of Public Health.

5 facilities compared · CMS & CA Dept. of Health data · Updated Apr 2026

Filter by care type
Culver West Health Center
NH

Nursing Home Licensed facility providing 24/7 skilled nursing care for residents with complex, ongoing medical needs. Staffed by RNs, LPNs, and CNAs. Inspected and star-rated annually by CMS. Accepts Medicare (short-term rehab) and Medicaid (long-term care).

AL

Assisted Living A licensed, long-term care setting for seniors or individuals with disabilities who need help with daily activities — like bathing, dressing, and medication management — but not 24-hour skilled nursing. Offers housing, meals, and around-the-clock support while aiming to maximize resident independence.

Los Angeles (Culver - West)
91
52.7%
-38%
3.62
-20%
-14%
1
59
3.7
1
76
A+
88
Culver West Health Center Llc
$11.5M
$5.4M
47%
55350
Semi-Private / Shared Rooms
Lighthouse Healthcare Center
NH

Nursing Home Licensed facility providing 24/7 skilled nursing care for residents with complex, ongoing medical needs. Staffed by RNs, LPNs, and CNAs. Inspected and star-rated annually by CMS. Accepts Medicare (short-term rehab) and Medicaid (long-term care).

AL

Assisted Living A licensed, long-term care setting for seniors or individuals with disabilities who need help with daily activities — like bathing, dressing, and medication management — but not 24-hour skilled nursing. Offers housing, meals, and around-the-clock support while aiming to maximize resident independence.

Los Angeles (South Los Angeles)
149
49.0%
-42%
4.74
-40%
+12%
1
71
5.5
2
125
-
69
Greenspoon, Aryen
$14.2M
$7.8M
55.1%
56478
Semi-Private / Shared Rooms
Avalon Villa Care Center
NH

Nursing Home Licensed facility providing 24/7 skilled nursing care for residents with complex, ongoing medical needs. Staffed by RNs, LPNs, and CNAs. Inspected and star-rated annually by CMS. Accepts Medicare (short-term rehab) and Medicaid (long-term care).

AL

Assisted Living A licensed, long-term care setting for seniors or individuals with disabilities who need help with daily activities — like bathing, dressing, and medication management — but not 24-hour skilled nursing. Offers housing, meals, and around-the-clock support while aiming to maximize resident independence.

Los Angeles (South Los Angeles)
131
90.1%
+6%
4.28
+53%
+1%
2
110
4.6
3
118
-
60
-
$16.4M
$7.5M
45.9%
56023
Semi-Private / Shared Rooms
Sharon Care Center
NH

Nursing Home Licensed facility providing 24/7 skilled nursing care for residents with complex, ongoing medical needs. Staffed by RNs, LPNs, and CNAs. Inspected and star-rated annually by CMS. Accepts Medicare (short-term rehab) and Medicaid (long-term care).

AL

Assisted Living A licensed, long-term care setting for seniors or individuals with disabilities who need help with daily activities — like bathing, dressing, and medication management — but not 24-hour skilled nursing. Offers housing, meals, and around-the-clock support while aiming to maximize resident independence.

Los Angeles (Central LA)
86
87.2%
+3%
3.74
-5%
-11%
1
111
3.6
5
78
-
95
Summit Care Llc
$14.5M
$5.7M
39.1%
55755
Semi-Private / Shared Rooms
Alta Vista Gardens
-
NH

Nursing Home Licensed facility providing 24/7 skilled nursing care for residents with complex, ongoing medical needs. Staffed by RNs, LPNs, and CNAs. Inspected and star-rated annually by CMS. Accepts Medicare (short-term rehab) and Medicaid (long-term care).

AL

Assisted Living A licensed, long-term care setting for seniors or individuals with disabilities who need help with daily activities — like bathing, dressing, and medication management — but not 24-hour skilled nursing. Offers housing, meals, and around-the-clock support while aiming to maximize resident independence.

LOS ANGELES
70
-
-
-
-
-
-
-
-
0
0
0.0
0
-
-
-
-
-
-
-
-
Semi-Private / Shared Rooms

Places of interest near Lighthouse Healthcare Center

Address 14.3 miles from city center

Address 2222 Santa Ana Blvd S, Los Angeles, CA 90059

Calculate Travel Distance to Lighthouse Healthcare Center

Add your location

Address

Staffing Data (Q2 2025)

This data corresponds to Q2 2025 and is based on CMS Payroll-Based Journal.

Total staff 198
Employees 171
Contractors 27
Staff to resident ratio 1.57:1
1571329% better than California average

California average ratio: 0.00:1

Avg staff/day 98
Average shift 7.1 hours
8% worse than California average

California average: 7.7 hours

Total staff hours (quarter) 63,553
Nursing staff breakdown
Registered Nurse

Manages medical care and health needs.

Total count 10
Average shift length Info Average shift length. Calculated as total hours divided by days worked and average staff per day. 7.6 hours

No contractors work on this role.

Licensed Practical Nurse

Assists with medical care and medications.

Total count 31
Average shift length Info Average shift length. Calculated as total hours divided by days worked and average staff per day. 7.7 hours

No contractors work on this role.

Certified Nursing Assistant

Helps with daily care and mobility.

Total count 111
Average shift length Info Average shift length. Calculated as total hours divided by days worked and average staff per day. 6.9 hours

No contractors work on this role.

Contractor staffing

Total hours from contractors

7.2%

4,568 contractor hours this quarter

Physical Therapy Aide: 7 Speech Language Pathologist: 5 Other Physician: 4 Respiratory Therapy Technician: 2 Diagnostic X-ray Services Staff: 2 Physical Therapy Assistant: 2 Qualified Social Worker: 2 Occupational Therapy Aide: 1 Occupational Therapy Assistant: 1 Medical Director: 1
Staff by category
Certified Nursing Assistant111011137,19591100%6.9
Licensed Practical Nurse3103110,42591100%7.7
Other Dietary Services Staff9093,75291100%8
Registered Nurse100102,76391100%7.6
Physical Therapy Aide0771,5458998%5.3
Speech Language Pathologist0551,37091100%6.4
Administrator2021,0216470%8.2
Dental Services Staff2029627886%8.1
RN Director of Nursing2028356470%8.2
Occupational Therapy Aide1126287077%7.7
Nurse Practitioner1015126470%8
Dietitian1015046369%8
Mental Health Service Worker1015046369%8
Physical Therapy Assistant0224555965%7.5
Respiratory Therapy Technician0224507077%5.5
Diagnostic X-ray Services Staff0223063134%7.5
Qualified Social Worker0221853640%5.1
Other Physician044903134%2.8
Occupational Therapy Assistant0114667%7.7
Medical Director011633%2
111 Certified Nursing Assistant
% of Days 100%
31 Licensed Practical Nurse
% of Days 100%
9 Other Dietary Services Staff
% of Days 100%
10 Registered Nurse
% of Days 100%
7 Physical Therapy Aide
% of Days 98%
5 Speech Language Pathologist
% of Days 100%
2 Administrator
% of Days 70%
2 Dental Services Staff
% of Days 86%
2 RN Director of Nursing
% of Days 70%
2 Occupational Therapy Aide
% of Days 77%
1 Nurse Practitioner
% of Days 70%
1 Dietitian
% of Days 69%
1 Mental Health Service Worker
% of Days 69%
2 Physical Therapy Assistant
% of Days 65%
2 Respiratory Therapy Technician
% of Days 77%
2 Diagnostic X-ray Services Staff
% of Days 34%
2 Qualified Social Worker
% of Days 40%
4 Other Physician
% of Days 34%
1 Occupational Therapy Assistant
% of Days 7%
1 Medical Director
% of Days 3%

Facility Characteristics

Source: CMS Long-Term Care Facility Characteristics (Data as of Jan 2026)

Total census
126 residents
Residents by payment source
Medicare
24 residents (19%)
Medicaid
95 residents (75.4%)
Private pay or other
7 residents (5.6%)
Programs & Services
Residents' Group

Residents meet regularly to discuss policies, care quality, and activities

Active Resident Council

Organized group of residents that meets regularly to discuss facility policies, quality of life, and activities.

Quality of care over time

These measures show how residents usually do over time at this home, based on health outcomes and preventive care.

High-risk clinical events score Info A composite score based on pressure ulcers, falls with injury, weight loss, walking ability decline, and activities of daily living decline. 9.8
48% worse than California average

California average: 6.6

Functional decline score Info A composite score based on activities of daily living decline, walking ability decline, and incontinence. 13.5
19% worse than California average

California average: 11.3

Long-stay resident measures
Below average California avg: 4.3 Info CMS star rating based on long-stay quality measure performance. 5 stars = significantly above average, 1 star = significantly below average.
Need for Help with Daily Activities Increased Info Percent of long-stay residents whose need for help with daily activities has increased 18.4%
66% worse than California average

California average: 11.1%

Walking Ability Worsened Info Percent of long-stay residents whose ability to move independently worsened 16.7%
39% worse than California average

California average: 12.0%

Low Risk Residents with Bowel/Bladder Incontinence Info Percent of low risk long-stay residents who lose control of their bowels or bladder 5.5%
52% better than California average

California average: 11.3%

Falls with Major Injury Info Percent of long-stay residents experiencing one or more falls with major injury 3.2%
94% worse than California average

California average: 1.7%

High Risk Residents with Pressure Ulcers Info Percent of long-stay high risk residents with pressure ulcers 2.1%
57% better than California average

California average: 5.0%

Urinary Tract Infection Info Percent of long-stay residents with a urinary tract infection 3.3%
166% worse than California average

California average: 1.2%

Lost Too Much Weight Info Percent of long-stay residents who lose too much weight 8.6%
104% worse than California average

California average: 4.2%

Depressive Symptoms Info Percent of long-stay residents who have depressive symptoms 2.3%
65% better than California average

California average: 6.7%

Antipsychotic Use Info Percent of long-stay residents who received an antipsychotic medication 6.1%
40% better than California average

California average: 10.1%

Pneumococcal Vaccine Info Percent of long-stay residents assessed and appropriately given the pneumococcal vaccine 92.2%
6% worse than California average

California average: 98.5%

Influenza Vaccine Info Percent of long-stay residents assessed and appropriately given the seasonal influenza vaccine 87.0%
11% worse than California average

California average: 98.2%

Hospitalizations per 1,000 days Info Number of hospitalizations per 1,000 long-stay resident days. 2.99
33% worse than California average

California average: 2.25

ED visits per 1,000 days Info Number of outpatient emergency department visits per 1,000 long-stay resident days. 1.47
8% better than California average

California average: 1.59

Short-stay resident measures
Significantly above average California avg: 3.5 Info CMS star rating based on short-stay quality measure performance. 5 stars = much above average, 1 star = much below average.
Pneumococcal Vaccine Info Percent of short-stay residents assessed and appropriately given the pneumococcal vaccine 30.7%
67% worse than California average

California average: 94.0%

Antipsychotic medication increase Info Percent of short-stay residents who newly received an antipsychotic medication 2.4%
64% worse than California average

California average: 1.5%

Influenza Vaccine Info Percent of short-stay residents assessed and appropriately given the seasonal influenza vaccine 25.0%
73% worse than California average

California average: 93.2%

Re-hospitalized after SNF stay Info Percentage of short-stay residents who were re-hospitalized after their nursing home admission. 18.5%
20% better than California average

California average: 23.2%

Emergency department visits Info Percentage of short-stay residents who had an outpatient emergency department visit. 3.5%
69% better than California average

California average: 11.2%

Falls with major injury Info Percentage of SNF residents who experience falls with major injury during their stay. 2.9%
271% worse than California average

California average: 0.8%

Ability to care for self at discharge Info Percentage of residents at or above expected ability to care for themselves at discharge. 65.2%
21% better than California average

California average: 53.7%

Successful return to home or community Info Rate of successful return to home or community from a skilled nursing facility. 16.7%
67% worse than California average

California average: 50.6%

Penalties and fines

Federal penalties imposed by CMS for regulatory violations, including civil money penalties (fines) and denials of payment for new Medicare/Medicaid admissions.

Source: CMS Penalties Database (Data as of Jan 2026)

Total fines amount $43K
22% lower than California average

California average: $55K

Number of fines 1
58% fewer fines than California average

California average: 2.4

Payment Denials Info Serious action where Medicare and/or Medicaid temporarily stops payments for new residents until issues are fixed. 1
102% more payment denials than California average

California average: 0.5

Fines amount comparison
This facility $43K
California average $55K
Penalty History

Penalties are imposed by CMS for violations of federal nursing home regulations.

Civil Money Penalty Info Fines imposed for noncompliance, which can be assessed per day or per instance of violation. Apr 9, 2024
$43K
Payment Denial Info Serious action where Medicare and/or Medicaid temporarily stops payments for new residents until issues are fixed. Apr 9, 2024
79 days

Last updated: Jan 2026

Guides for Better Senior Living

Care Cost Calculator: See Prices in Your Area

Nursing Home Data Explorer

Don’t Wait Too Long: 7 Red Flag Signs Your Parent Needs Assisted Living Now

The True Cost of Assisted Living in 2025 – And How Families Are Paying For It

Understanding Senior Living Costs: Pricing Models, Discounts & Financial Assistance

Financial Aid for California Seniors

Get financial aid guidance

Multipurpose Senior Services Program

MSSP (Medi-Cal Waiver)

Age 65+, California resident, Medi-Cal eligible, nursing home risk.

~$2,829/month (300% FBR, individual).

$2,000 (individual), $3,000 (couple).

County-managed; waitlists possible.

In-Home Supportive Services (IHSS)

California IHSS

Age 65+, California resident, Medicaid-eligible or low-income.

~$1,732/month (individual, Medi-Cal threshold).

$2,000 (individual).

Can hire family as caregivers.

Multipurpose Senior Services Program (MSSP)

CA MSSP

Age 65+, California resident, Medi-Cal-eligible, nursing home-eligible but community-capable.

~$2,829/month (300% FBR, individual).

$2,000 (individual).

Available in 38 counties; waitlists common.

Property Tax Postponement Program (PTP)

CA PTP

Age 62+, California resident, own and live in home, 40% equity.

~$51,500/year (household, adjusted annually).

Equity-based; no strict asset cap.

Deferred taxes accrue interest (5% as of 2024); repaid upon sale/death.

Assisted Living Waiver (ALW)

CA ALW

Age 65+ or disabled, California resident, Medi-Cal-eligible, nursing home-eligible.

~$2,829/month (300% FBR, individual).

$2,000 (individual).

Available in 15 counties (e.g., LA, Sacramento); waitlists common.

California CARES Program

CA CARES

Caregivers of California residents 60+ needing help with 3+ daily activities; no caregiver age limit.

No strict limit; cost-sharing above ~$2,500/month threshold.

Not applicable; need-based.

High demand in urban areas; complements IHSS respite.

Low-Income Home Energy Assistance Program (LIHEAP)

CA LIHEAP

Age 60+ priority, California resident, low-income, utility/heating need.

~$2,510/month (200% of poverty level, individual).

Not applicable; income-focused.

High demand in inland/coastal extremes; weatherization capped at $5,000/home.

Tour Icon
Planning a tour? Check our touring checklist.
Chat Icon
Thinking of living here? We can help you speak to a current resident