


Explore Open Rooms
1
Contact details
2
What type of senior care service are you looking for?
3
What budget do you have in mind for senior care?
4
How soon do you need to find care?
5
Additional details
Thank you for your interest!
Our team will be in touch shortly to help with next steps.
Compare Senior Communities around Maryland The information below is reported by the Maryland Department of Health, Office of Health Care Quality.
Click column headers to sort
| Sunrise of Silver Spring |
AL Assisted Living A licensed, long-term care setting for seniors or individuals with disabilities who need help with daily activities — like bathing, dressing, and medication management — but not 24-hour skilled nursing. Offers housing, meals, and around-the-clock support while aiming to maximize resident independence.
MC Memory Care Secured, specialized care for people living with Alzheimer's or dementia. Staff trained in cognitive impairment, with higher staff-to-resident ratios and an environment designed to reduce confusion and wandering risk. | Silver Spring | 84 | Yes | 40 | Studio / 1 Bed / 2 Bed | 24 | - |
31% Male Residents — State Benchmarked 31% of residents are male, compared to the Maryland average of 31%. This facility caters to a majority female resident pool (69% female), consistent with the broader assisted living trend where women significantly outnumber men. |
69% Female Residents — State Benchmarked 69% of residents are female, compared to the Maryland average of 69%. Women comprise the large majority, consistent with national assisted living demographics where women live longer and enter care facilities at higher rates. |
53% White Residents — State Benchmarked 53% of residents are reported as White, compared to the Maryland average of 81%. A lower White share than the Maryland average — the community may draw a more diverse resident mix relative to other facilities in Maryland. |
39% African American Residents — State Benchmarked 39% of residents are reported as African American or Black, compared to the Maryland average of 12%. A higher African American share than the typical Maryland average — useful context when comparing cultural fit and community composition. |
9% Other Ethnicity Residents — State Benchmarked 9% of residents fall into categories other than White or African American (combined), compared to the Maryland average of 7%. This column aggregates Hispanic, Asian, multiracial, and any other labeled groups that are not classified as White or African American. Reported subgroups in this total: Asian (4%), Hawaiian/Pacific Islander (3%), Hispanic (1%). |
4% Residents Age 65–74 — State Benchmarked 4% of residents are 65–74, compared to the Maryland average of 12%. Fewer younger seniors suggests the resident population skews older, likely requiring higher acuity care and more hands-on support. |
43% Residents Age 75–84 — State Benchmarked 43% of residents are 75–84, compared to the Maryland average of 31%. A high concentration in this mid-range bracket, where residents typically need moderate support with daily activities. |
37% Residents Age 85–94 — State Benchmarked 37% of residents are 85–94, compared to the Maryland average of 44%. The population here skews younger than the statewide norm, which may indicate a more active, lower-acuity community. |
14% Residents Age 95+ — State Benchmarked 14% of residents are 95 or older, compared to the Maryland average of 16%. In line with the statewide profile for the oldest resident bracket. |
| Brightview Annapolis |
MC Memory Care Secured, specialized care for people living with Alzheimer's or dementia. Staff trained in cognitive impairment, with higher staff-to-resident ratios and an environment designed to reduce confusion and wandering risk.
AL Assisted Living A licensed, long-term care setting for seniors or individuals with disabilities who need help with daily activities — like bathing, dressing, and medication management — but not 24-hour skilled nursing. Offers housing, meals, and around-the-clock support while aiming to maximize resident independence. | Annapolis | 85 | Yes | 34 | Studio / 1 Bed / 2 Bed | 7 | - |
27% Male Residents — State Benchmarked 27% of residents are male, compared to the Maryland average of 31%. This facility caters to a majority female resident pool (73% female), consistent with the broader assisted living trend where women significantly outnumber men. |
73% Female Residents — State Benchmarked 73% of residents are female, compared to the Maryland average of 69%. Women comprise the large majority, consistent with national assisted living demographics where women live longer and enter care facilities at higher rates. |
97% White Residents — State Benchmarked 97% of residents are reported as White, compared to the Maryland average of 81%. A higher White share than is typical for assisted living in Maryland in this dataset — compare with peer facilities for local context. |
0% African American Residents — State Benchmarked 0% of residents are reported as African American or Black, compared to the Maryland average of 12%. A lower African American share than is typical in Maryland; local markets still vary widely. |
3% Other Ethnicity Residents — State Benchmarked 3% of residents fall into categories other than White or African American (combined), compared to the Maryland average of 7%. This column aggregates Hispanic, Asian, multiracial, and any other labeled groups that are not classified as White or African American. Reported subgroups in this total: Hispanic (3%). |
3% Residents Age 65–74 — State Benchmarked 3% of residents are 65–74, compared to the Maryland average of 12%. Fewer younger seniors suggests the resident population skews older, likely requiring higher acuity care and more hands-on support. |
27% Residents Age 75–84 — State Benchmarked 27% of residents are 75–84, compared to the Maryland average of 31%. This is the second most common age bracket in assisted living, representing residents with moderate care needs. |
59% Residents Age 85–94 — State Benchmarked 59% of residents are 85–94, compared to the Maryland average of 44%. A high concentration of very elderly residents signals a higher-acuity facility with experience caring for advanced age-related needs. |
9% Residents Age 95+ — State Benchmarked 9% of residents are 95 or older, compared to the Maryland average of 16%. Most residents here have not yet reached the oldest-old bracket, suggesting a younger overall community. |
| Modena Reserve at Kensington |
AL Assisted Living A licensed, long-term care setting for seniors or individuals with disabilities who need help with daily activities — like bathing, dressing, and medication management — but not 24-hour skilled nursing. Offers housing, meals, and around-the-clock support while aiming to maximize resident independence.
IL Independent Living Lifestyle-focused communities for older adults offering dining, activities, and transportation with minimal personal care. Best for active, independent seniors who want community without medical support.
MC Memory Care Secured, specialized care for people living with Alzheimer's or dementia. Staff trained in cognitive impairment, with higher staff-to-resident ratios and an environment designed to reduce confusion and wandering risk.
NH Nursing Home Licensed facility providing 24/7 skilled nursing care for residents with complex, ongoing medical needs. Staffed by RNs, LPNs, and CNAs. Inspected and star-rated annually by CMS. Accepts Medicare (short-term rehab) and Medicaid (long-term care). | Kensington | 80 | No | 85 | - | 4 | - | - | - | - | - | - | - | - | - | - |
| Bay Village of Annapolis |
AL Assisted Living A licensed, long-term care setting for seniors or individuals with disabilities who need help with daily activities — like bathing, dressing, and medication management — but not 24-hour skilled nursing. Offers housing, meals, and around-the-clock support while aiming to maximize resident independence. | Annapolis | 88 | Yes | 75 | Studio / 1 Bed | 5 | - |
32% Male Residents — State Benchmarked 32% of residents are male, compared to the Maryland average of 31%. This facility caters to a majority female resident pool (68% female), consistent with the broader assisted living trend where women significantly outnumber men. |
68% Female Residents — State Benchmarked 68% of residents are female, compared to the Maryland average of 69%. Women comprise the large majority, consistent with national assisted living demographics where women live longer and enter care facilities at higher rates. |
99% White Residents — State Benchmarked 99% of residents are reported as White, compared to the Maryland average of 81%. A higher White share than is typical for assisted living in Maryland in this dataset — compare with peer facilities for local context. |
0% African American Residents — State Benchmarked 0% of residents are reported as African American or Black, compared to the Maryland average of 12%. A lower African American share than is typical in Maryland; local markets still vary widely. |
1% Other Ethnicity Residents — State Benchmarked 1% of residents fall into categories other than White or African American (combined), compared to the Maryland average of 7%. This column aggregates Hispanic, Asian, multiracial, and any other labeled groups that are not classified as White or African American. Reported subgroups in this total: Hispanic (1%). |
14% Residents Age 65–74 — State Benchmarked 14% of residents are 65–74, compared to the Maryland average of 12%. In line with the statewide profile for this youngest senior bracket in assisted living. |
28% Residents Age 75–84 — State Benchmarked 28% of residents are 75–84, compared to the Maryland average of 31%. This is the second most common age bracket in assisted living, representing residents with moderate care needs. |
50% Residents Age 85–94 — State Benchmarked 50% of residents are 85–94, compared to the Maryland average of 44%. A high concentration of very elderly residents signals a higher-acuity facility with experience caring for advanced age-related needs. |
8% Residents Age 95+ — State Benchmarked 8% of residents are 95 or older, compared to the Maryland average of 16%. Most residents here have not yet reached the oldest-old bracket, suggesting a younger overall community. |
| Brightview Rolling Hills |
MC Memory Care Secured, specialized care for people living with Alzheimer's or dementia. Staff trained in cognitive impairment, with higher staff-to-resident ratios and an environment designed to reduce confusion and wandering risk.
AL Assisted Living A licensed, long-term care setting for seniors or individuals with disabilities who need help with daily activities — like bathing, dressing, and medication management — but not 24-hour skilled nursing. Offers housing, meals, and around-the-clock support while aiming to maximize resident independence. | Catonsville | 81 | Yes | 19 | Studio / 1 Bed /2 Bed | 11 | A+ |
16% Male Residents — State Benchmarked 16% of residents are male, compared to the Maryland average of 31%. This facility caters to a majority female resident pool (84% female), consistent with the broader assisted living trend where women significantly outnumber men. |
84% Female Residents — State Benchmarked 84% of residents are female, compared to the Maryland average of 69%. Women comprise the large majority, consistent with national assisted living demographics where women live longer and enter care facilities at higher rates. |
95% White Residents — State Benchmarked 95% of residents are reported as White, compared to the Maryland average of 81%. A higher White share than is typical for assisted living in Maryland in this dataset — compare with peer facilities for local context. |
3% African American Residents — State Benchmarked 3% of residents are reported as African American or Black, compared to the Maryland average of 12%. A lower African American share than is typical in Maryland; local markets still vary widely. |
2% Other Ethnicity Residents — State Benchmarked 2% of residents fall into categories other than White or African American (combined), compared to the Maryland average of 7%. This column aggregates Hispanic, Asian, multiracial, and any other labeled groups that are not classified as White or African American. Reported subgroups in this total: Asian (2%). | - |
8% Residents Age 75–84 — State Benchmarked 8% of residents are 75–84, compared to the Maryland average of 31%. Below the state norm — the resident mix may skew either younger or older than this typical middle bracket. |
83% Residents Age 85–94 — State Benchmarked 83% of residents are 85–94, compared to the Maryland average of 44%. A high concentration of very elderly residents signals a higher-acuity facility with experience caring for advanced age-related needs. |
10% Residents Age 95+ — State Benchmarked 10% of residents are 95 or older, compared to the Maryland average of 16%. Most residents here have not yet reached the oldest-old bracket, suggesting a younger overall community. |
| Brightview Mays Chapel Ridge |
MC Memory Care Secured, specialized care for people living with Alzheimer's or dementia. Staff trained in cognitive impairment, with higher staff-to-resident ratios and an environment designed to reduce confusion and wandering risk.
AL Assisted Living A licensed, long-term care setting for seniors or individuals with disabilities who need help with daily activities — like bathing, dressing, and medication management — but not 24-hour skilled nursing. Offers housing, meals, and around-the-clock support while aiming to maximize resident independence.
IL Independent Living Lifestyle-focused communities for older adults offering dining, activities, and transportation with minimal personal care. Best for active, independent seniors who want community without medical support. | Timonium | 89 | No | 52 | Studio / 1 Bed / 2 Bed | 24 | - |
13% Male Residents — State Benchmarked 13% of residents are male, compared to the Maryland average of 31%. This facility caters to a majority female resident pool (87% female), consistent with the broader assisted living trend where women significantly outnumber men. |
87% Female Residents — State Benchmarked 87% of residents are female, compared to the Maryland average of 69%. Women comprise the large majority, consistent with national assisted living demographics where women live longer and enter care facilities at higher rates. |
99% White Residents — State Benchmarked 99% of residents are reported as White, compared to the Maryland average of 81%. A higher White share than is typical for assisted living in Maryland in this dataset — compare with peer facilities for local context. |
0% African American Residents — State Benchmarked 0% of residents are reported as African American or Black, compared to the Maryland average of 12%. A lower African American share than is typical in Maryland; local markets still vary widely. |
1% Other Ethnicity Residents — State Benchmarked 1% of residents fall into categories other than White or African American (combined), compared to the Maryland average of 7%. This column aggregates Hispanic, Asian, multiracial, and any other labeled groups that are not classified as White or African American. Reported subgroups in this total: Asian (1%). |
3% Residents Age 65–74 — State Benchmarked 3% of residents are 65–74, compared to the Maryland average of 12%. Fewer younger seniors suggests the resident population skews older, likely requiring higher acuity care and more hands-on support. |
30% Residents Age 75–84 — State Benchmarked 30% of residents are 75–84, compared to the Maryland average of 31%. This is the second most common age bracket in assisted living, representing residents with moderate care needs. |
48% Residents Age 85–94 — State Benchmarked 48% of residents are 85–94, compared to the Maryland average of 44%. This is typically the most common age bracket in assisted living — this facility is in line with the statewide norm. |
18% Residents Age 95+ — State Benchmarked 18% of residents are 95 or older, compared to the Maryland average of 16%. In line with the statewide profile for the oldest resident bracket. |
| Brightview Crofton Riverwalk |
AL Assisted Living A licensed, long-term care setting for seniors or individuals with disabilities who need help with daily activities — like bathing, dressing, and medication management — but not 24-hour skilled nursing. Offers housing, meals, and around-the-clock support while aiming to maximize resident independence.
IL Independent Living Lifestyle-focused communities for older adults offering dining, activities, and transportation with minimal personal care. Best for active, independent seniors who want community without medical support.
MC Memory Care Secured, specialized care for people living with Alzheimer's or dementia. Staff trained in cognitive impairment, with higher staff-to-resident ratios and an environment designed to reduce confusion and wandering risk.
NH Nursing Home Licensed facility providing 24/7 skilled nursing care for residents with complex, ongoing medical needs. Staffed by RNs, LPNs, and CNAs. Inspected and star-rated annually by CMS. Accepts Medicare (short-term rehab) and Medicaid (long-term care). | Crofton | 92 | Yes | 45 | Studio / 1 Bed / 2 Bed | 6 | - |
27% Male Residents — State Benchmarked 27% of residents are male, compared to the Maryland average of 31%. This facility caters to a majority female resident pool (73% female), consistent with the broader assisted living trend where women significantly outnumber men. |
73% Female Residents — State Benchmarked 73% of residents are female, compared to the Maryland average of 69%. Women comprise the large majority, consistent with national assisted living demographics where women live longer and enter care facilities at higher rates. |
0% White Residents — State Benchmarked 0% of residents are reported as White, compared to the Maryland average of 81%. A lower White share than the Maryland average — the community may draw a more diverse resident mix relative to other facilities in Maryland. |
0% African American Residents — State Benchmarked 0% of residents are reported as African American or Black, compared to the Maryland average of 12%. A lower African American share than is typical in Maryland; local markets still vary widely. |
100% Other Ethnicity Residents — State Benchmarked 100% of residents fall into categories other than White or African American (combined), compared to the Maryland average of 7%. This column aggregates Hispanic, Asian, multiracial, and any other labeled groups that are not classified as White or African American. Reported subgroups in this total: Other (100%). | - | - | - | - |
| Sunrise of Frederick |
AL Assisted Living A licensed, long-term care setting for seniors or individuals with disabilities who need help with daily activities — like bathing, dressing, and medication management — but not 24-hour skilled nursing. Offers housing, meals, and around-the-clock support while aiming to maximize resident independence.
HC Home Care Professional care delivered in the person's own home — from companionship and errands to skilled nursing and therapy. Allows seniors to age in place. Medicare covers skilled home health when medically necessary.
HC Home Care Professional care delivered in the person's own home — from companionship and errands to skilled nursing and therapy. Allows seniors to age in place. Medicare covers skilled home health when medically necessary.
IL Independent Living Lifestyle-focused communities for older adults offering dining, activities, and transportation with minimal personal care. Best for active, independent seniors who want community without medical support.
MC Memory Care Secured, specialized care for people living with Alzheimer's or dementia. Staff trained in cognitive impairment, with higher staff-to-resident ratios and an environment designed to reduce confusion and wandering risk.
NH Nursing Home Licensed facility providing 24/7 skilled nursing care for residents with complex, ongoing medical needs. Staffed by RNs, LPNs, and CNAs. Inspected and star-rated annually by CMS. Accepts Medicare (short-term rehab) and Medicaid (long-term care). | Frederick (Waterford) | 88 | Yes | 62 | Studio / Suite / 2 Bed | 34 | A- |
31% Male Residents — State Benchmarked 31% of residents are male, compared to the Maryland average of 31%. This facility caters to a majority female resident pool (69% female), consistent with the broader assisted living trend where women significantly outnumber men. |
69% Female Residents — State Benchmarked 69% of residents are female, compared to the Maryland average of 69%. Women comprise the large majority, consistent with national assisted living demographics where women live longer and enter care facilities at higher rates. |
97% White Residents — State Benchmarked 97% of residents are reported as White, compared to the Maryland average of 81%. A higher White share than is typical for assisted living in Maryland in this dataset — compare with peer facilities for local context. |
2% African American Residents — State Benchmarked 2% of residents are reported as African American or Black, compared to the Maryland average of 12%. A lower African American share than is typical in Maryland; local markets still vary widely. |
2% Other Ethnicity Residents — State Benchmarked 2% of residents fall into categories other than White or African American (combined), compared to the Maryland average of 7%. This column aggregates Hispanic, Asian, multiracial, and any other labeled groups that are not classified as White or African American. Reported subgroups in this total: Hispanic (2%). |
10% Residents Age 65–74 — State Benchmarked 10% of residents are 65–74, compared to the Maryland average of 12%. In line with the statewide profile for this youngest senior bracket in assisted living. |
34% Residents Age 75–84 — State Benchmarked 34% of residents are 75–84, compared to the Maryland average of 31%. This is the second most common age bracket in assisted living, representing residents with moderate care needs. |
48% Residents Age 85–94 — State Benchmarked 48% of residents are 85–94, compared to the Maryland average of 44%. This is typically the most common age bracket in assisted living — this facility is in line with the statewide norm. |
6% Residents Age 95+ — State Benchmarked 6% of residents are 95 or older, compared to the Maryland average of 16%. Most residents here have not yet reached the oldest-old bracket, suggesting a younger overall community. |
| Sunrise of Rockville |
AL Assisted Living A licensed, long-term care setting for seniors or individuals with disabilities who need help with daily activities — like bathing, dressing, and medication management — but not 24-hour skilled nursing. Offers housing, meals, and around-the-clock support while aiming to maximize resident independence. | Rockville | 89 | Yes | 89 | Studio / 1 Bed / 2 Bed | 28 | A- |
23% Male Residents — State Benchmarked 23% of residents are male, compared to the Maryland average of 31%. This facility caters to a majority female resident pool (77% female), consistent with the broader assisted living trend where women significantly outnumber men. |
77% Female Residents — State Benchmarked 77% of residents are female, compared to the Maryland average of 69%. Women comprise the large majority, consistent with national assisted living demographics where women live longer and enter care facilities at higher rates. |
87% White Residents — State Benchmarked 87% of residents are reported as White, compared to the Maryland average of 81%. Close to the average for this category among assisted living facilities in Maryland with reported race/ethnicity data. |
2% African American Residents — State Benchmarked 2% of residents are reported as African American or Black, compared to the Maryland average of 12%. A lower African American share than is typical in Maryland; local markets still vary widely. |
11% Other Ethnicity Residents — State Benchmarked 11% of residents fall into categories other than White or African American (combined), compared to the Maryland average of 7%. This column aggregates Hispanic, Asian, multiracial, and any other labeled groups that are not classified as White or African American. Reported subgroups in this total: Mixed Race (6%), Hispanic (3%), Asian (2%). |
3% Residents Age 65–74 — State Benchmarked 3% of residents are 65–74, compared to the Maryland average of 12%. Fewer younger seniors suggests the resident population skews older, likely requiring higher acuity care and more hands-on support. |
31% Residents Age 75–84 — State Benchmarked 31% of residents are 75–84, compared to the Maryland average of 31%. This is the second most common age bracket in assisted living, representing residents with moderate care needs. |
56% Residents Age 85–94 — State Benchmarked 56% of residents are 85–94, compared to the Maryland average of 44%. A high concentration of very elderly residents signals a higher-acuity facility with experience caring for advanced age-related needs. |
10% Residents Age 95+ — State Benchmarked 10% of residents are 95 or older, compared to the Maryland average of 16%. Most residents here have not yet reached the oldest-old bracket, suggesting a younger overall community. |
| Arbor Terrace at Waugh Chapel |
AL Assisted Living A licensed, long-term care setting for seniors or individuals with disabilities who need help with daily activities — like bathing, dressing, and medication management — but not 24-hour skilled nursing. Offers housing, meals, and around-the-clock support while aiming to maximize resident independence.
MC Memory Care Secured, specialized care for people living with Alzheimer's or dementia. Staff trained in cognitive impairment, with higher staff-to-resident ratios and an environment designed to reduce confusion and wandering risk. | Gambrills | 96 | No | 47 | - | 7 | A+ |
30% Male Residents — State Benchmarked 30% of residents are male, compared to the Maryland average of 31%. This facility caters to a majority female resident pool (70% female), consistent with the broader assisted living trend where women significantly outnumber men. |
70% Female Residents — State Benchmarked 70% of residents are female, compared to the Maryland average of 69%. Women comprise the large majority, consistent with national assisted living demographics where women live longer and enter care facilities at higher rates. |
86% White Residents — State Benchmarked 86% of residents are reported as White, compared to the Maryland average of 81%. Close to the average for this category among assisted living facilities in Maryland with reported race/ethnicity data. |
12% African American Residents — State Benchmarked 12% of residents are reported as African American or Black, compared to the Maryland average of 12%. In line with the Maryland average for African American residents among facilities reporting this breakdown. |
3% Other Ethnicity Residents — State Benchmarked 3% of residents fall into categories other than White or African American (combined), compared to the Maryland average of 7%. This column aggregates Hispanic, Asian, multiracial, and any other labeled groups that are not classified as White or African American. Reported subgroups in this total: Asian (1%), Hawaiian/Pacific Islander (1%). |
10% Residents Age 65–74 — State Benchmarked 10% of residents are 65–74, compared to the Maryland average of 12%. In line with the statewide profile for this youngest senior bracket in assisted living. |
43% Residents Age 75–84 — State Benchmarked 43% of residents are 75–84, compared to the Maryland average of 31%. A high concentration in this mid-range bracket, where residents typically need moderate support with daily activities. |
39% Residents Age 85–94 — State Benchmarked 39% of residents are 85–94, compared to the Maryland average of 44%. This is typically the most common age bracket in assisted living — this facility is in line with the statewide norm. |
8% Residents Age 95+ — State Benchmarked 8% of residents are 95 or older, compared to the Maryland average of 16%. Most residents here have not yet reached the oldest-old bracket, suggesting a younger overall community. |
| Celebration Villa of Manresa |
AL Assisted Living A licensed, long-term care setting for seniors or individuals with disabilities who need help with daily activities — like bathing, dressing, and medication management — but not 24-hour skilled nursing. Offers housing, meals, and around-the-clock support while aiming to maximize resident independence.
RC Respite Care Short-term temporary care — days to weeks — to give family caregivers a break. Full care provided during the stay. Often used after hospitalization or to trial a facility before a permanent placement decision. | Annapolis | 86 | Yes | 2 | Studio / 1 Bed | 3 | - |
35% Male Residents — State Benchmarked 35% of residents are male, compared to the Maryland average of 31%. This facility caters to a majority female resident pool (65% female), consistent with the broader assisted living trend where women significantly outnumber men. |
65% Female Residents — State Benchmarked 65% of residents are female, compared to the Maryland average of 69%. Women comprise the large majority, consistent with national assisted living demographics where women live longer and enter care facilities at higher rates. |
97% White Residents — State Benchmarked 97% of residents are reported as White, compared to the Maryland average of 81%. A higher White share than is typical for assisted living in Maryland in this dataset — compare with peer facilities for local context. |
3% African American Residents — State Benchmarked 3% of residents are reported as African American or Black, compared to the Maryland average of 12%. A lower African American share than is typical in Maryland; local markets still vary widely. |
0% Other Ethnicity Residents — State Benchmarked 0% of residents fall into categories other than White or African American (combined), compared to the Maryland average of 7%. This column aggregates Hispanic, Asian, multiracial, and any other labeled groups that are not classified as White or African American. |
8% Residents Age 65–74 — State Benchmarked 8% of residents are 65–74, compared to the Maryland average of 12%. Fewer younger seniors suggests the resident population skews older, likely requiring higher acuity care and more hands-on support. |
52% Residents Age 75–84 — State Benchmarked 52% of residents are 75–84, compared to the Maryland average of 31%. A high concentration in this mid-range bracket, where residents typically need moderate support with daily activities. |
27% Residents Age 85–94 — State Benchmarked 27% of residents are 85–94, compared to the Maryland average of 44%. The population here skews younger than the statewide norm, which may indicate a more active, lower-acuity community. |
13% Residents Age 95+ — State Benchmarked 13% of residents are 95 or older, compared to the Maryland average of 16%. In line with the statewide profile for the oldest resident bracket. |
| Queenstown Landing |
AL Assisted Living A licensed, long-term care setting for seniors or individuals with disabilities who need help with daily activities — like bathing, dressing, and medication management — but not 24-hour skilled nursing. Offers housing, meals, and around-the-clock support while aiming to maximize resident independence. | Baltimore | 78 | No | 10 | - | 5 | - |
35% Male Residents — State Benchmarked 35% of residents are male, compared to the Maryland average of 31%. This facility caters to a majority female resident pool (65% female), consistent with the broader assisted living trend where women significantly outnumber men. |
65% Female Residents — State Benchmarked 65% of residents are female, compared to the Maryland average of 69%. Women comprise the large majority, consistent with national assisted living demographics where women live longer and enter care facilities at higher rates. |
98% White Residents — State Benchmarked 98% of residents are reported as White, compared to the Maryland average of 81%. A higher White share than is typical for assisted living in Maryland in this dataset — compare with peer facilities for local context. |
2% African American Residents — State Benchmarked 2% of residents are reported as African American or Black, compared to the Maryland average of 12%. A lower African American share than is typical in Maryland; local markets still vary widely. |
0% Other Ethnicity Residents — State Benchmarked 0% of residents fall into categories other than White or African American (combined), compared to the Maryland average of 7%. This column aggregates Hispanic, Asian, multiracial, and any other labeled groups that are not classified as White or African American. | - |
5% Residents Age 75–84 — State Benchmarked 5% of residents are 75–84, compared to the Maryland average of 31%. Below the state norm — the resident mix may skew either younger or older than this typical middle bracket. |
88% Residents Age 85–94 — State Benchmarked 88% of residents are 85–94, compared to the Maryland average of 44%. A high concentration of very elderly residents signals a higher-acuity facility with experience caring for advanced age-related needs. |
7% Residents Age 95+ — State Benchmarked 7% of residents are 95 or older, compared to the Maryland average of 16%. Most residents here have not yet reached the oldest-old bracket, suggesting a younger overall community. |
| Arbor Terrace Waugh Chapel |
MC Memory Care Secured, specialized care for people living with Alzheimer's or dementia. Staff trained in cognitive impairment, with higher staff-to-resident ratios and an environment designed to reduce confusion and wandering risk.
AL Assisted Living A licensed, long-term care setting for seniors or individuals with disabilities who need help with daily activities — like bathing, dressing, and medication management — but not 24-hour skilled nursing. Offers housing, meals, and around-the-clock support while aiming to maximize resident independence. | Gambrills | 96 | Yes | 47 | Studio / 1 Bed / 2 Bed | 7 | A+ |
30% Male Residents — State Benchmarked 30% of residents are male, compared to the Maryland average of 31%. This facility caters to a majority female resident pool (70% female), consistent with the broader assisted living trend where women significantly outnumber men. |
70% Female Residents — State Benchmarked 70% of residents are female, compared to the Maryland average of 69%. Women comprise the large majority, consistent with national assisted living demographics where women live longer and enter care facilities at higher rates. |
86% White Residents — State Benchmarked 86% of residents are reported as White, compared to the Maryland average of 81%. Close to the average for this category among assisted living facilities in Maryland with reported race/ethnicity data. |
12% African American Residents — State Benchmarked 12% of residents are reported as African American or Black, compared to the Maryland average of 12%. In line with the Maryland average for African American residents among facilities reporting this breakdown. |
3% Other Ethnicity Residents — State Benchmarked 3% of residents fall into categories other than White or African American (combined), compared to the Maryland average of 7%. This column aggregates Hispanic, Asian, multiracial, and any other labeled groups that are not classified as White or African American. Reported subgroups in this total: Asian (1%), Hawaiian/Pacific Islander (1%). |
10% Residents Age 65–74 — State Benchmarked 10% of residents are 65–74, compared to the Maryland average of 12%. In line with the statewide profile for this youngest senior bracket in assisted living. |
43% Residents Age 75–84 — State Benchmarked 43% of residents are 75–84, compared to the Maryland average of 31%. A high concentration in this mid-range bracket, where residents typically need moderate support with daily activities. |
39% Residents Age 85–94 — State Benchmarked 39% of residents are 85–94, compared to the Maryland average of 44%. This is typically the most common age bracket in assisted living — this facility is in line with the statewide norm. |
8% Residents Age 95+ — State Benchmarked 8% of residents are 95 or older, compared to the Maryland average of 16%. Most residents here have not yet reached the oldest-old bracket, suggesting a younger overall community. |
| Brookdale Olney |
AL Assisted Living A licensed, long-term care setting for seniors or individuals with disabilities who need help with daily activities — like bathing, dressing, and medication management — but not 24-hour skilled nursing. Offers housing, meals, and around-the-clock support while aiming to maximize resident independence.
MC Memory Care Secured, specialized care for people living with Alzheimer's or dementia. Staff trained in cognitive impairment, with higher staff-to-resident ratios and an environment designed to reduce confusion and wandering risk. | Olney | 94 | Yes | 16 | Studio / 1 Bed / 2 Bed | 13 | - |
33% Male Residents — State Benchmarked 33% of residents are male, compared to the Maryland average of 31%. This facility caters to a majority female resident pool (67% female), consistent with the broader assisted living trend where women significantly outnumber men. |
67% Female Residents — State Benchmarked 67% of residents are female, compared to the Maryland average of 69%. Women comprise the large majority, consistent with national assisted living demographics where women live longer and enter care facilities at higher rates. |
94% White Residents — State Benchmarked 94% of residents are reported as White, compared to the Maryland average of 81%. A higher White share than is typical for assisted living in Maryland in this dataset — compare with peer facilities for local context. |
3% African American Residents — State Benchmarked 3% of residents are reported as African American or Black, compared to the Maryland average of 12%. A lower African American share than is typical in Maryland; local markets still vary widely. |
3% Other Ethnicity Residents — State Benchmarked 3% of residents fall into categories other than White or African American (combined), compared to the Maryland average of 7%. This column aggregates Hispanic, Asian, multiracial, and any other labeled groups that are not classified as White or African American. Reported subgroups in this total: Asian (3%). |
8% Residents Age 65–74 — State Benchmarked 8% of residents are 65–74, compared to the Maryland average of 12%. Fewer younger seniors suggests the resident population skews older, likely requiring higher acuity care and more hands-on support. |
39% Residents Age 75–84 — State Benchmarked 39% of residents are 75–84, compared to the Maryland average of 31%. A high concentration in this mid-range bracket, where residents typically need moderate support with daily activities. |
22% Residents Age 85–94 — State Benchmarked 22% of residents are 85–94, compared to the Maryland average of 44%. The population here skews younger than the statewide norm, which may indicate a more active, lower-acuity community. |
28% Residents Age 95+ — State Benchmarked 28% of residents are 95 or older, compared to the Maryland average of 16%. A high proportion of the oldest-old suggests strong end-of-life care experience and very-high-acuity capabilities. |
| Charter Senior Living of Towson |
MC Memory Care Secured, specialized care for people living with Alzheimer's or dementia. Staff trained in cognitive impairment, with higher staff-to-resident ratios and an environment designed to reduce confusion and wandering risk.
AL Assisted Living A licensed, long-term care setting for seniors or individuals with disabilities who need help with daily activities — like bathing, dressing, and medication management — but not 24-hour skilled nursing. Offers housing, meals, and around-the-clock support while aiming to maximize resident independence. | Baltimore | 92 | No | 36 | Studio / 1 Bed | 5 | - |
25% Male Residents — State Benchmarked 25% of residents are male, compared to the Maryland average of 31%. This facility caters to a majority female resident pool (75% female), consistent with the broader assisted living trend where women significantly outnumber men. |
75% Female Residents — State Benchmarked 75% of residents are female, compared to the Maryland average of 69%. Women comprise the large majority, consistent with national assisted living demographics where women live longer and enter care facilities at higher rates. |
88% White Residents — State Benchmarked 88% of residents are reported as White, compared to the Maryland average of 81%. Close to the average for this category among assisted living facilities in Maryland with reported race/ethnicity data. |
7% African American Residents — State Benchmarked 7% of residents are reported as African American or Black, compared to the Maryland average of 12%. In line with the Maryland average for African American residents among facilities reporting this breakdown. |
4% Other Ethnicity Residents — State Benchmarked 4% of residents fall into categories other than White or African American (combined), compared to the Maryland average of 7%. This column aggregates Hispanic, Asian, multiracial, and any other labeled groups that are not classified as White or African American. Reported subgroups in this total: Asian (3%), Hispanic (1%). | - |
22% Residents Age 75–84 — State Benchmarked 22% of residents are 75–84, compared to the Maryland average of 31%. Below the state norm — the resident mix may skew either younger or older than this typical middle bracket. |
60% Residents Age 85–94 — State Benchmarked 60% of residents are 85–94, compared to the Maryland average of 44%. A high concentration of very elderly residents signals a higher-acuity facility with experience caring for advanced age-related needs. |
15% Residents Age 95+ — State Benchmarked 15% of residents are 95 or older, compared to the Maryland average of 16%. In line with the statewide profile for the oldest resident bracket. |
Rows per page:

View all Nearby Homes
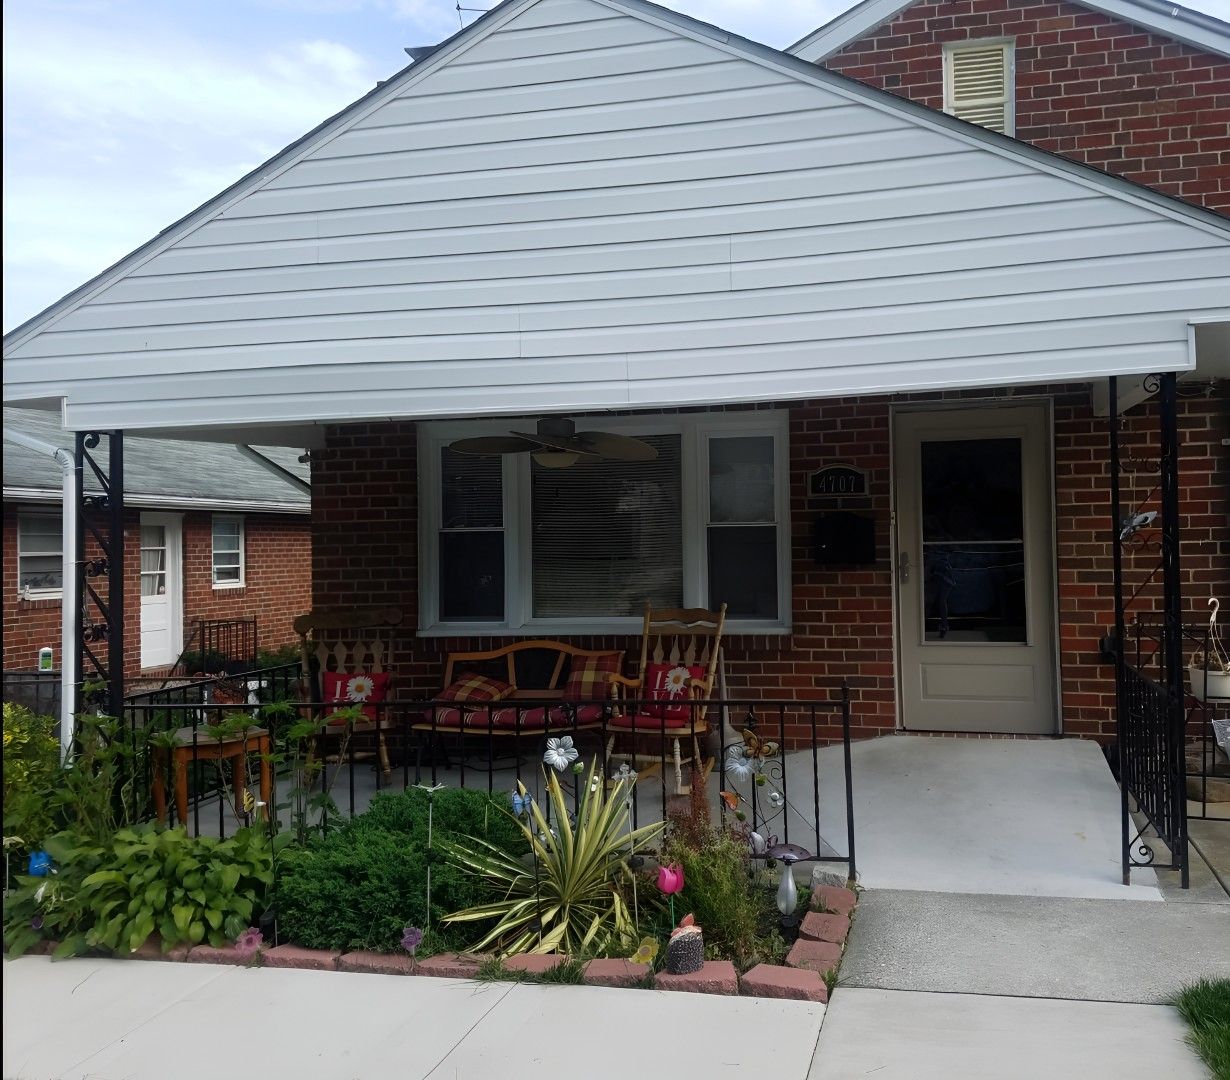
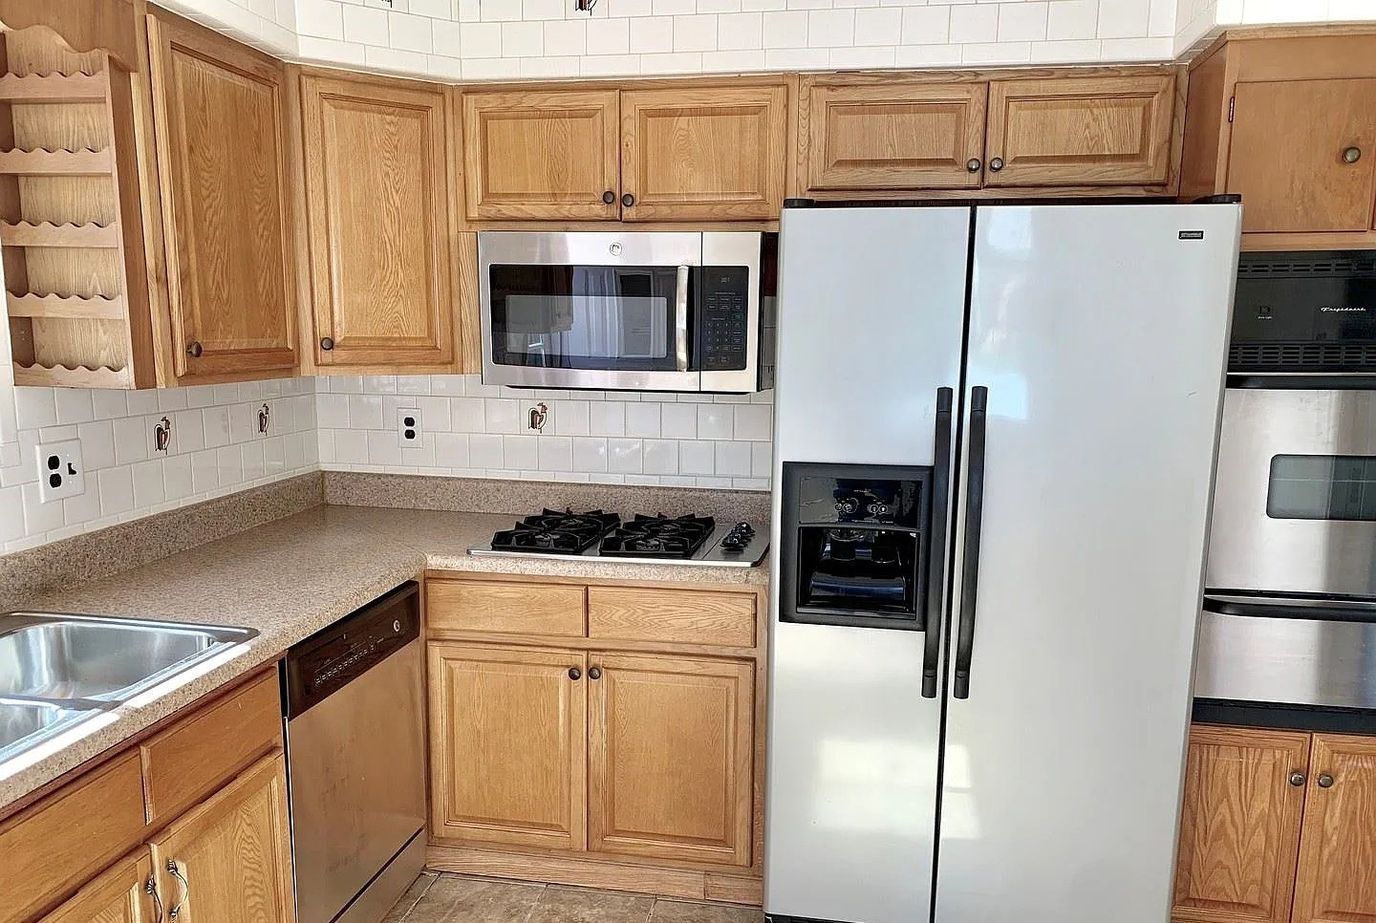
Overview of Howell’s Care 3


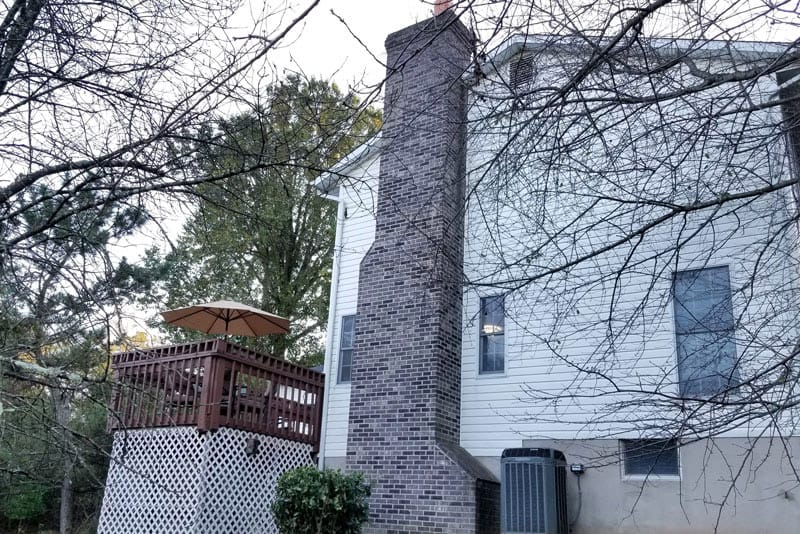
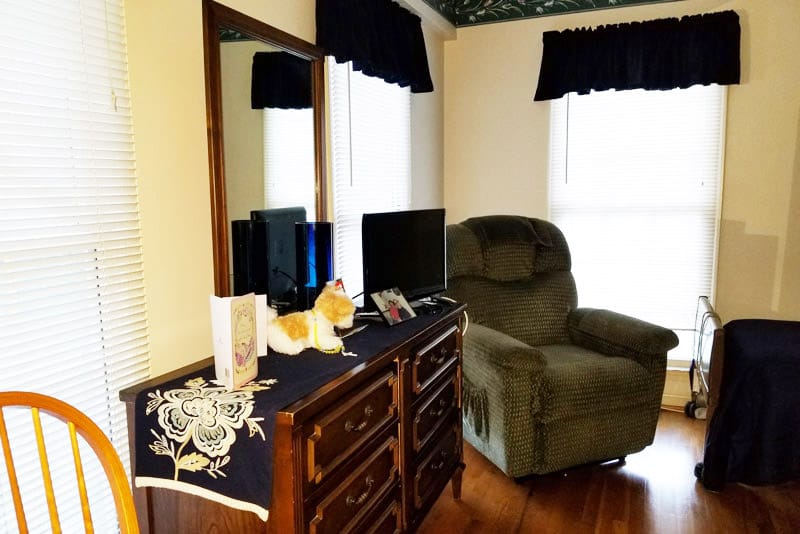
Discover the charm and warmth of Howell’s Care 3, situated in the beautiful town of Baltimore, MD, providing assisted living services. Designed for hassle-free living, this community provides a safe and attractive setting where residents can embrace independence with dignity. Through its highly equipped and passionate team, residents have the freedom to age in place with services tailored to their health needs over time.
This community offers a truly unique approach to retirement, where seniors can live life on their terms, surrounded by refined living and exceptional amenities and services. Aside from convenient accommodations, residents can also enjoy customizable lifestyle options, along with top-notch personalized care. Here, the inspiring environment and exceptional services provide a fresh perspective on retirement, allowing seniors to thrive and be themselves every step of the way.
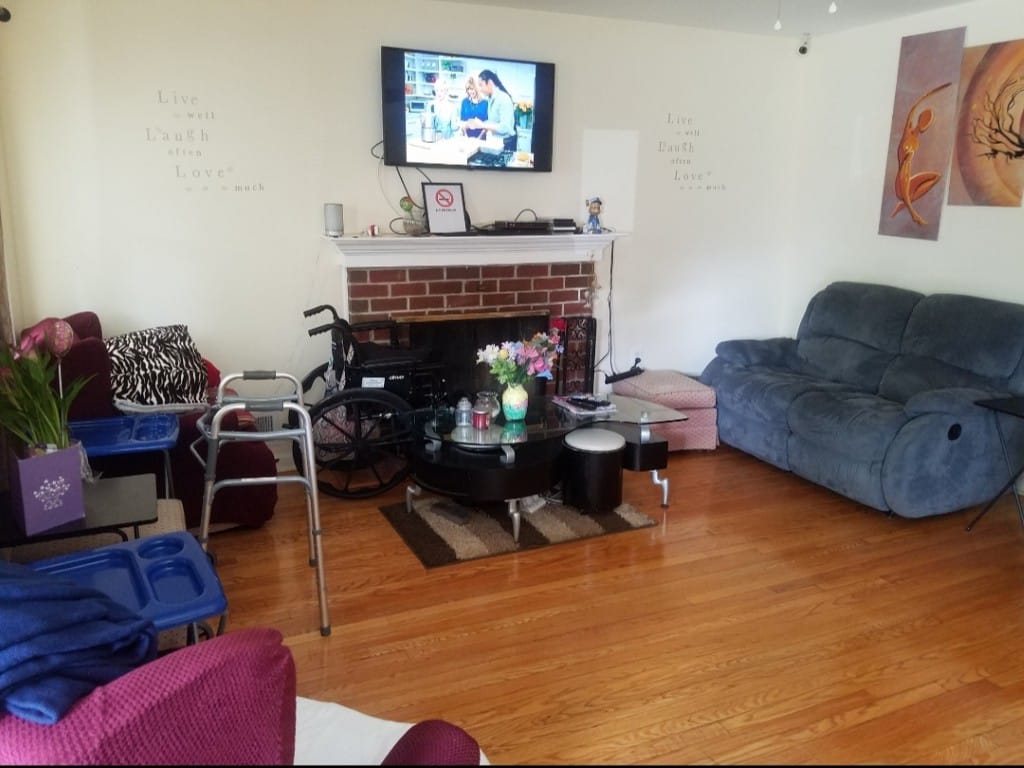
What does this home offer?
Room Sizes: Private / Semi-Private Rooms
With a top-notch level of care in Burtonsville, Autumn Lake Healthcare at Oak Manor is the ideal nursing home to receive good care in serene surroundings. The premier nursing home is composed of a professional care staff who brings excellence to the recovery of every senior; residents can genuinely feel the high-end quality of sub-acute rehabilitation and long-term care in a nurturing environment. Autumn Lake Healthcare at Oak Manor is where to rest, recover, and rejuvenate.
Expect nothing but quality regarding their service: an advanced level of recovery focused on short-term and long-term skilled nursing care. Comprehensive medical support includes pain management, stroke recovery, diabetes management, cardiac care, memory care, lymphedema management, dialysis, bariatric, palliative care, hospice care, and restorative care.
Autumn Lake Healthcare at Oak Manor is an independently owned and operated healthcare center that is licensed to use the Autumn Lake Healthcare name and receive non-healthcare related services. All healthcare-related services are provided solely by Autumn Lake Healthcare at Oak Manor.
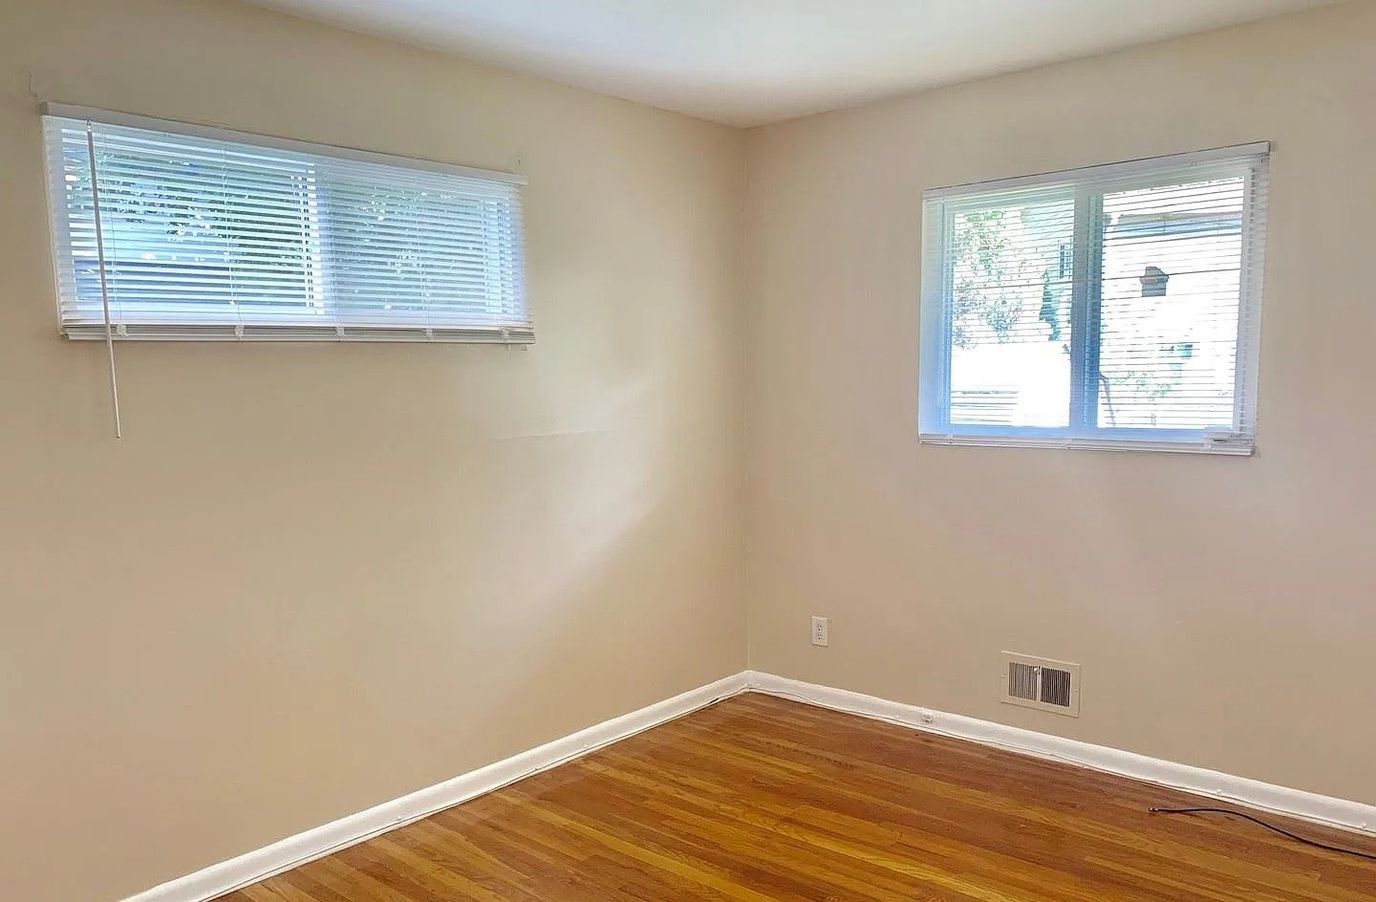
A retirement home catered to 62+ seniors, Taney Village strives to make a positive impact in the lives of each resident; they are ready to attend to any needs an individual may have. The staff encourages residents to take part in enriching and engaging activities that cultivate their personal growth during their golden years. The vibrant community offers a home-like atmosphere that can provide all the essential benefits for its residents, as they make it a point to enhance the lifestyle of every resident and elevate their daily living.
Taney Village residents can enjoy seamless access to living spaces like a lounge room, fitness center, dining area, and outdoor common areas. Other services include essential housekeeping, laundry, and transportation, medication management, and recreational activities.
What does this home offer?
Minimum Age: 62 Years Old
Pets Allowed: Yes, Pets Allowed
Housing Options: 1 Bed
Building Type: High-rise
Transportation Services
Fitness and Recreation
Overview of Complete Care in Hyattsville

Complete Care in Hyattsville is a community where meaningful moments unfold and families find solace in making the best decisions for their loved ones’ health and well-being. Clinical expertise is at the heart of their services. From specialized memory care to respiratory, renal, cardiac, and orthopedic rehabilitation, their team of professionals brings unparalleled knowledge and skill to every aspect of care. Residents can rest assured knowing they are in the hands of a community that goes above and beyond to provide exceptional rehabilitation and long-term care programs, promoting swift recovery and overall wellness.
The secure and beautifully designed memory care unit ensures a safe and comforting environment, while spacious rooms provide a serene and personal space for residents. With the most advanced tools and equipment, residents also benefit from the latest advancements in healthcare. The dedicated staff is available around the clock, ensuring that residents receive prompt and attentive care. A specialized team of physicians, therapists, and specialists work in harmony to provide comprehensive support. The community maintains affiliations with reputable area hospitals as well, ensuring a seamless continuum of care.
Nestled in the serene locale of Hyattsville lies Hands & Heart Assisted Living, a tranquil haven where seniors can experience independence and optimal health. Since 2018, they have been providing exceptional care for seniors. This cozy community provides personalized living spaces that residents can call their own, while also offering a variety of social activities to foster connection and community.
The home also provides top-notch memory care services in a secure environment designed specifically for seniors with memory loss. The cooking staff is especially commendable, and the community boasts beautiful outdoor common areas for relaxation and socializing. In addition to physical care, Hands & Heart Assisted Living also offers spiritual support with devotional services both on and off-site. Housekeeping and linen services are also included, so residents can focus on enjoying their golden years to the fullest. At Hands & Heart Assisted Living, seniors can build genuine relationships and cherish memories for a lifetime.
Peacefully set in the tranquil residential area of Baltimore, MD, My Caring Hands LLC is an esteemed community that offers assisted living. Residents here enjoy the highest quality of care tailored to their daily living activities from a kind and highly qualified team available 24/7. The community also helps with cleaning, laundry, and other household chores, ensuring residents enjoy a hassle-free lifestyle.
With a variety of fun activities and engaging exercises, residents have more opportunities to meet new friends and gain meaningful experiences. Ensuring a satisfactory dining experience, delicious and healthy meals are served that cater to dietary needs and preferences. Here, residents do not have to worry about their prescriptions with medication management. The community’s supportive and friendly setting welcomes residents and allows them to have a blissful retirement.
What does this home offer?
Building Type: Single-story
Dining Services
Housekeeping Services
Social and Recreational Activities
Peacefully nestled in the tree-lined neighborhood of Randallstown, MD, Trinity Care of Love is an outstanding haven that offers assisted living. With a compassionate and highly qualified team available 24/7, residents receive top-notch assistance for their daily living activities, including grooming and dressing. The maintenance of beautifully furnished and cozy accommodations is also taken care of, ensuring residents can feel at ease during their stay.
Fun exercises and engaging events are conducted for residents’ holistic wellness. Mealtimes are also thoughtfully planned to meet residents’ dietary needs and preferences, ensuring the finest dining experience. With medication management, residents do not have to worry about their prescriptions. Promoting a nurturing and supportive environment, the community ensures residents make every moment of their golden years count.
What does this home offer?
Housing Options: Private / Shared Rooms
Building Type: Single-story
Dining Services
Housekeeping Services
Social and Recreational Activities
Overview of Angel Assisted Living

Angel Assisted Living in Lanham, Maryland prioritizes affordability and a independence for their residents. With balanced lifestyle that blends comfort and calmness with the full support you or your loved one needs. A worry-free environment where daily tasks are handled with ease. Angel Assisted Living provides laundry services, transportation to appointments and outings, and delicious home-cooked meals, all designed to free residents to focus on enjoying life. Social and fitness activities promote a sense of well-being and connection with others.
At Angel, a dedicated staff is available 24/7 to offer day-to-day assistance in a warm and inviting environment. Housekeeping services ensure a clean and comfortable living space, and residents can look forward to delicious homemade meals prepared with love. A licensed physician visits each facility weekly to monitor residents’ health, and a certified nurse ensures medications and treatments are up-to-date. For added convenience, a local pharmacy delivers medications directly to the home.
What does this home offer?
Housing Options: Private Rooms
Building Type: Single-story
Transportation Services
Fitness and Recreation
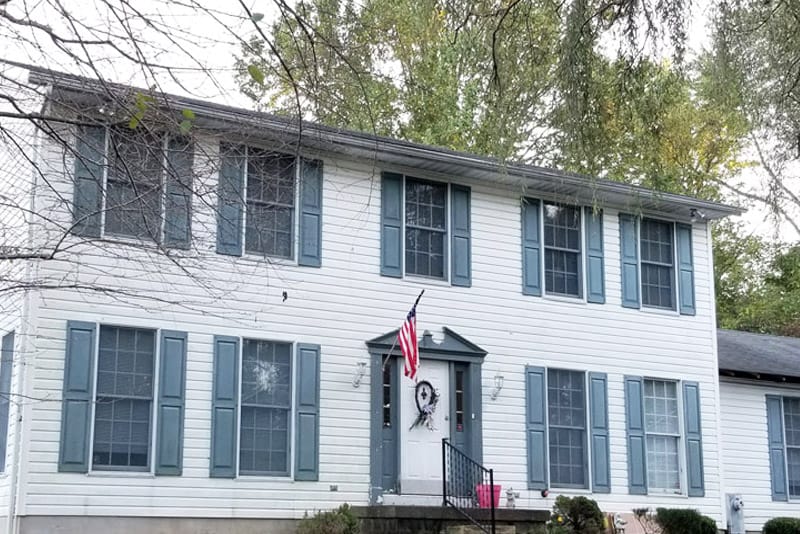
Experience the utmost care and assistance that you deserve with the outstanding senior living community of Ovalstone Comfort Home – Welling Lane in Welling Lane, Bowie, MD, providing residential and medical services. With round-the-clock care and supervision from a kind and reliable team, seniors can rest assured of enjoying a maintenance-free retirement. Let go of your worries and live happily surrounded by accessible amenities and senior-friendly spaces.
Make the most out of your golden years by doing the things you love through fun activities and enriching programs. Mingle with friends over healthy and delicious meals that satisfy dietary needs and preferences. Ovalstone Comfort Home – Welling Lane is a haven for seniors who require extra assistance in their daily living while maintaining an active and vibrant retirement.
What does this home offer?
Housing Options: Private / Semi-Private Rooms
Building Type: Single-story
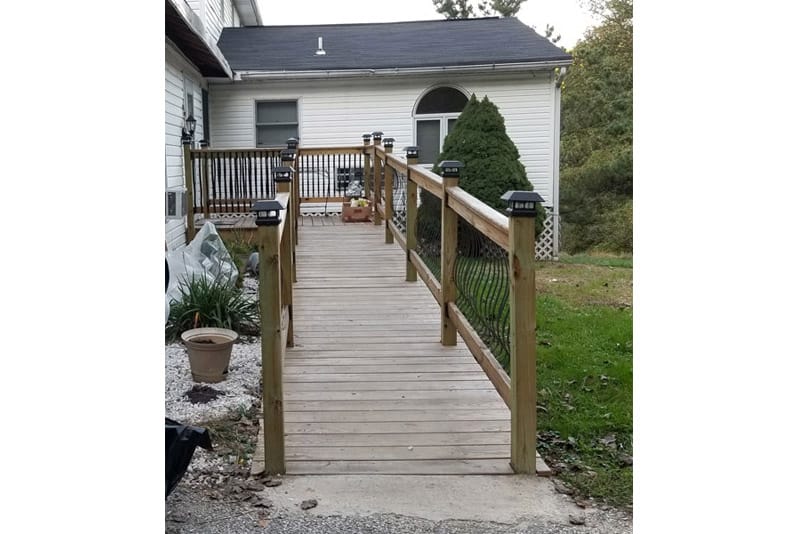
Dulaney Valley Assisted Living at Hunt Valley is a serene and peaceful senior living community in Hunt Valley, MD, that offers assisted living services. Residents are provided with private or semi-private accommodations set in 2 acres of gorgeous land and equipped with all the pleasures in life. Committed to residents’ well-being, the community provides residents with individualized care plans overseen by a registered nurse, a team of compassionate caregivers, and access to physical therapy and respite care.
In addition to comprehensive care services, the community makes sure residents are also presented with an abundance of opportunities for connecting with like-minded individuals, learning new things or making new experiences. From exercise programs to entertainment and other planned activities, residents are sure to find something to enjoy. Residents’ living experience is complete with three nutritious and delicious meals and snacks served in a cozy dining space.
What does this home offer?
Housing Options: Private Rooms / Semi-Private Rooms
Building Type: Two-story

3 Nutritious Meals per Day

Medication Management

Free Parking Available

Engaging Activities
Ranking Methodology
How we rank these communities
Every community above is evaluated across six weighted categories using public data including state inspection records, review platforms, BBB profiles, and operator-published materials.
Weighting overview
35%
Resident Experience
25%
Regulatory
15%
Visual Media
10%
Website
10%
Stability
5%
Environment
01
Resident & Family Experience 35%
The single largest share of every ranking. Aggregated review sentiment and volume from major platforms — the closest signal to real resident experience.
Includes
Review Sentiment
Review Volume
02
Regulatory & Safety Record 25%
State inspection records, citations, and complaint visits. We weight per-inspection rates more heavily than raw counts.
Includes
State Inspections
Citations/Inspection
% Inspections w/ Citations
Complaint Visits
Accreditations
BBB Rating
03
Visual Media & Transparency 15%
Communities that publish high-quality visuals give families a real preview. No photos or tours = a negative transparency signal.
Includes
Video Tours
Virtual Walkthroughs
Photo Quantity
Photo Quality
04
Website & Operator Transparency 10%
Site quality and whether the operator publishes basic accountability information — staff names, contact details, ownership.
Includes
Website Content
Mobile Usability
Staff Info Available
Owner Info Available
05
Community Stability 10%
Operational signals indicating whether a community is well-run and meeting demand.
Includes
Occupancy Rate
Bed Options
06
Environment & Pricing 5%
Walkability and pricing transparency. Walk Score is weighted higher for Independent Living than for Memory Care, where most residents do not leave unaccompanied.
Includes
Walk Score
Pricing Transparency
Nearby Cities
Who we are
Your Senior Care Partner, Every Step of the Way
We help families find affordable senior communities and unlock same day discounts, Medicaid, and Medicare options tailored to your needs.
Contact us Today
Frequently Asked Questions
What government services provide money for senior housing?
Several government programs offer financial assistance for senior housing in various countries, focusing on the United States for a broad overview:
- Medicaid: Medicaid is a state and federally funded program that can cover the costs of nursing home care for those who meet eligibility criteria, including income and asset limits. Some states also offer Medicaid waivers that help pay for home and community-based services to prevent or delay nursing home placement.
- Medicare: Medicare, primarily a health insurance program for people aged 65 and over, does not cover long-term housing costs. However, it can cover short-term stays in a skilled nursing facility under specific conditions following a hospital stay.
- Section 202 Supportive Housing for the Elderly Program: This program provides housing for low-income seniors. It offers rental assistance and access to supportive services, such as cleaning, cooking, and transportation.
- Low-Income Housing Tax Credit (LIHTC) Properties: While not a direct subsidy, LIHTC encourages developers to create affordable housing. Seniors with low incomes can find reduced-rent apartments through this program.
- State and Local Programs: Many states, counties, and cities offer their own programs to assist seniors with housing costs. These can include property tax relief programs, rental assistance programs, and programs that offer affordable senior housing options.
- Veterans Affairs (VA): The VA offers several programs for veterans, including the Aid and Attendance benefit, which provides monthly payments to veterans who require the aid of another person, or are housebound, to help cover the cost of care in homes, nursing homes, and assisted living facilities.
- Social Security: While Social Security primarily provides retirement income, for many seniors, these benefits are a crucial part of their budget, including housing costs.
How do you pick the homes you recommend?
Before recommending homes, we conduct a thorough evaluation on crucial factors that define a senior home such as the quality of care they provide, the reputation of the organization, and a comprehensive review of community testimonials as well. Every detail is assessed to assure that seniors are offered not just senior care options, but trustworthy homes where they can experience the care that they deserve.
Do you help families that need Medicaid?
Yes. Assisting families who need Medicaid is important to us as it plays a crucial role in offering financial support to seniors confronting economic challenges. We would like to keep essential healthcare services accessible to all community members, irrespective of one’s financial circumstances.
How much does this service cost?
We extend our services at no cost, ensuring that families and seniors can benefit from tailored assistance in their search for care and home options. Our ability to offer personalized guidance without charge to families and seniors is made possible through the support and funding from the communities with which we team up.
What services do you offer?
- Finding and ranking the best assisted living facilities
- Finding and ranking the best nursing homes
- Finding and ranking the best memory care facilities
- Our concierge service helps seniors move into the perfect home for them
- Helping seniors use medicare, medicaid, and other government programs to pay for their homes
- Helping seniors avoid senior homes that have bad service or fraud
- Autobiography & Family History Writing + Research
- Senior-focused concierge medicine
- Senior-focused nutritionist
- Senior-focused personal training
- Memory care specialists
- Custom wheelchairs at all price points.
- Custom hearing aids
- Cosmetic skincare + dermatology
- Companionship: We offer in-person and virtual companionship services. Someone engaging to hang out with or talk to on video chat.
- Senior housing concierge. Our service finds the best senior living options based on your needs, income, and personality.

Published on
Updated on
Feedback
