


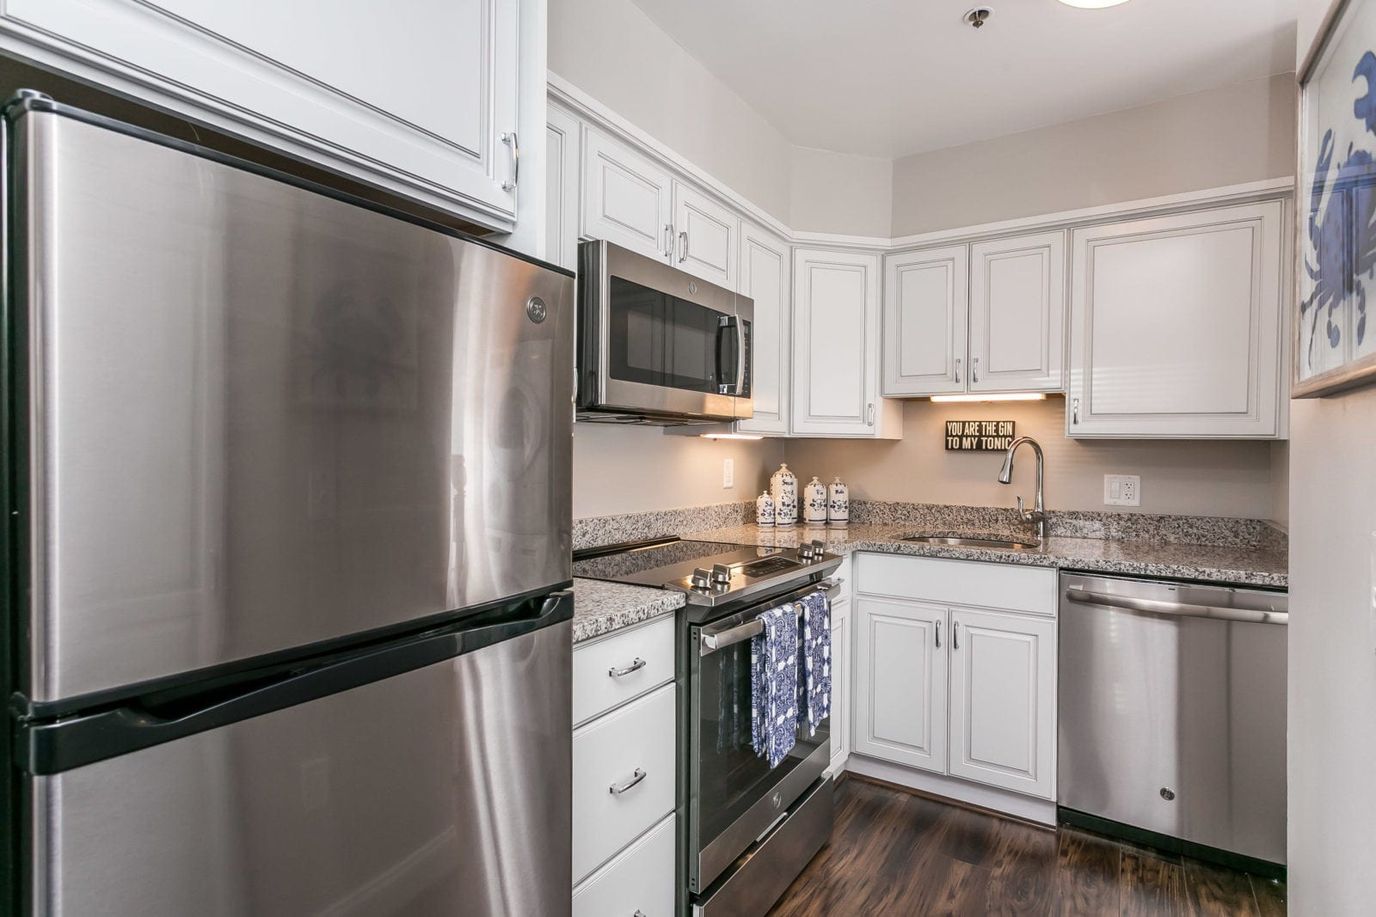


Explore Open Rooms
1
Contact details
2
What type of senior care service are you looking for?
3
What budget do you have in mind for senior care?
4
How soon do you need to find care?
5
Additional details
Thank you for your interest!
Our team will be in touch shortly to help with next steps.
Compare Senior Communities around Maryland The information below is reported by the Maryland Department of Health, Office of Health Care Quality.
Click column headers to sort
| Sunrise of Silver Spring |
AL Assisted Living A licensed, long-term care setting for seniors or individuals with disabilities who need help with daily activities — like bathing, dressing, and medication management — but not 24-hour skilled nursing. Offers housing, meals, and around-the-clock support while aiming to maximize resident independence.
MC Memory Care Secured, specialized care for people living with Alzheimer's or dementia. Staff trained in cognitive impairment, with higher staff-to-resident ratios and an environment designed to reduce confusion and wandering risk. | Silver Spring | 84 | Yes | 40 | Studio / 1 Bed / 2 Bed | 24 | - |
31% Male Residents — State Benchmarked 31% of residents are male, compared to the Maryland average of 31%. This facility caters to a majority female resident pool (69% female), consistent with the broader assisted living trend where women significantly outnumber men. |
69% Female Residents — State Benchmarked 69% of residents are female, compared to the Maryland average of 69%. Women comprise the large majority, consistent with national assisted living demographics where women live longer and enter care facilities at higher rates. |
53% White Residents — State Benchmarked 53% of residents are reported as White, compared to the Maryland average of 81%. A lower White share than the Maryland average — the community may draw a more diverse resident mix relative to other facilities in Maryland. |
39% African American Residents — State Benchmarked 39% of residents are reported as African American or Black, compared to the Maryland average of 12%. A higher African American share than the typical Maryland average — useful context when comparing cultural fit and community composition. |
9% Other Ethnicity Residents — State Benchmarked 9% of residents fall into categories other than White or African American (combined), compared to the Maryland average of 7%. This column aggregates Hispanic, Asian, multiracial, and any other labeled groups that are not classified as White or African American. Reported subgroups in this total: Asian (4%), Hawaiian/Pacific Islander (3%), Hispanic (1%). |
4% Residents Age 65–74 — State Benchmarked 4% of residents are 65–74, compared to the Maryland average of 12%. Fewer younger seniors suggests the resident population skews older, likely requiring higher acuity care and more hands-on support. |
43% Residents Age 75–84 — State Benchmarked 43% of residents are 75–84, compared to the Maryland average of 31%. A high concentration in this mid-range bracket, where residents typically need moderate support with daily activities. |
37% Residents Age 85–94 — State Benchmarked 37% of residents are 85–94, compared to the Maryland average of 44%. The population here skews younger than the statewide norm, which may indicate a more active, lower-acuity community. |
14% Residents Age 95+ — State Benchmarked 14% of residents are 95 or older, compared to the Maryland average of 16%. In line with the statewide profile for the oldest resident bracket. |
| Brightview Annapolis |
MC Memory Care Secured, specialized care for people living with Alzheimer's or dementia. Staff trained in cognitive impairment, with higher staff-to-resident ratios and an environment designed to reduce confusion and wandering risk.
AL Assisted Living A licensed, long-term care setting for seniors or individuals with disabilities who need help with daily activities — like bathing, dressing, and medication management — but not 24-hour skilled nursing. Offers housing, meals, and around-the-clock support while aiming to maximize resident independence. | Annapolis | 85 | Yes | 34 | Studio / 1 Bed / 2 Bed | 7 | - |
27% Male Residents — State Benchmarked 27% of residents are male, compared to the Maryland average of 31%. This facility caters to a majority female resident pool (73% female), consistent with the broader assisted living trend where women significantly outnumber men. |
73% Female Residents — State Benchmarked 73% of residents are female, compared to the Maryland average of 69%. Women comprise the large majority, consistent with national assisted living demographics where women live longer and enter care facilities at higher rates. |
97% White Residents — State Benchmarked 97% of residents are reported as White, compared to the Maryland average of 81%. A higher White share than is typical for assisted living in Maryland in this dataset — compare with peer facilities for local context. |
0% African American Residents — State Benchmarked 0% of residents are reported as African American or Black, compared to the Maryland average of 12%. A lower African American share than is typical in Maryland; local markets still vary widely. |
3% Other Ethnicity Residents — State Benchmarked 3% of residents fall into categories other than White or African American (combined), compared to the Maryland average of 7%. This column aggregates Hispanic, Asian, multiracial, and any other labeled groups that are not classified as White or African American. Reported subgroups in this total: Hispanic (3%). |
3% Residents Age 65–74 — State Benchmarked 3% of residents are 65–74, compared to the Maryland average of 12%. Fewer younger seniors suggests the resident population skews older, likely requiring higher acuity care and more hands-on support. |
27% Residents Age 75–84 — State Benchmarked 27% of residents are 75–84, compared to the Maryland average of 31%. This is the second most common age bracket in assisted living, representing residents with moderate care needs. |
59% Residents Age 85–94 — State Benchmarked 59% of residents are 85–94, compared to the Maryland average of 44%. A high concentration of very elderly residents signals a higher-acuity facility with experience caring for advanced age-related needs. |
9% Residents Age 95+ — State Benchmarked 9% of residents are 95 or older, compared to the Maryland average of 16%. Most residents here have not yet reached the oldest-old bracket, suggesting a younger overall community. |
| Modena Reserve at Kensington |
AL Assisted Living A licensed, long-term care setting for seniors or individuals with disabilities who need help with daily activities — like bathing, dressing, and medication management — but not 24-hour skilled nursing. Offers housing, meals, and around-the-clock support while aiming to maximize resident independence.
IL Independent Living Lifestyle-focused communities for older adults offering dining, activities, and transportation with minimal personal care. Best for active, independent seniors who want community without medical support.
MC Memory Care Secured, specialized care for people living with Alzheimer's or dementia. Staff trained in cognitive impairment, with higher staff-to-resident ratios and an environment designed to reduce confusion and wandering risk.
NH Nursing Home Licensed facility providing 24/7 skilled nursing care for residents with complex, ongoing medical needs. Staffed by RNs, LPNs, and CNAs. Inspected and star-rated annually by CMS. Accepts Medicare (short-term rehab) and Medicaid (long-term care). | Kensington | 80 | No | 85 | - | 4 | - | - | - | - | - | - | - | - | - | - |
| Bay Village of Annapolis |
AL Assisted Living A licensed, long-term care setting for seniors or individuals with disabilities who need help with daily activities — like bathing, dressing, and medication management — but not 24-hour skilled nursing. Offers housing, meals, and around-the-clock support while aiming to maximize resident independence. | Annapolis | 88 | Yes | 75 | Studio / 1 Bed | 5 | - |
32% Male Residents — State Benchmarked 32% of residents are male, compared to the Maryland average of 31%. This facility caters to a majority female resident pool (68% female), consistent with the broader assisted living trend where women significantly outnumber men. |
68% Female Residents — State Benchmarked 68% of residents are female, compared to the Maryland average of 69%. Women comprise the large majority, consistent with national assisted living demographics where women live longer and enter care facilities at higher rates. |
99% White Residents — State Benchmarked 99% of residents are reported as White, compared to the Maryland average of 81%. A higher White share than is typical for assisted living in Maryland in this dataset — compare with peer facilities for local context. |
0% African American Residents — State Benchmarked 0% of residents are reported as African American or Black, compared to the Maryland average of 12%. A lower African American share than is typical in Maryland; local markets still vary widely. |
1% Other Ethnicity Residents — State Benchmarked 1% of residents fall into categories other than White or African American (combined), compared to the Maryland average of 7%. This column aggregates Hispanic, Asian, multiracial, and any other labeled groups that are not classified as White or African American. Reported subgroups in this total: Hispanic (1%). |
14% Residents Age 65–74 — State Benchmarked 14% of residents are 65–74, compared to the Maryland average of 12%. In line with the statewide profile for this youngest senior bracket in assisted living. |
28% Residents Age 75–84 — State Benchmarked 28% of residents are 75–84, compared to the Maryland average of 31%. This is the second most common age bracket in assisted living, representing residents with moderate care needs. |
50% Residents Age 85–94 — State Benchmarked 50% of residents are 85–94, compared to the Maryland average of 44%. A high concentration of very elderly residents signals a higher-acuity facility with experience caring for advanced age-related needs. |
8% Residents Age 95+ — State Benchmarked 8% of residents are 95 or older, compared to the Maryland average of 16%. Most residents here have not yet reached the oldest-old bracket, suggesting a younger overall community. |
| Brightview Rolling Hills |
MC Memory Care Secured, specialized care for people living with Alzheimer's or dementia. Staff trained in cognitive impairment, with higher staff-to-resident ratios and an environment designed to reduce confusion and wandering risk.
AL Assisted Living A licensed, long-term care setting for seniors or individuals with disabilities who need help with daily activities — like bathing, dressing, and medication management — but not 24-hour skilled nursing. Offers housing, meals, and around-the-clock support while aiming to maximize resident independence. | Catonsville | 81 | Yes | 19 | Studio / 1 Bed /2 Bed | 11 | A+ |
16% Male Residents — State Benchmarked 16% of residents are male, compared to the Maryland average of 31%. This facility caters to a majority female resident pool (84% female), consistent with the broader assisted living trend where women significantly outnumber men. |
84% Female Residents — State Benchmarked 84% of residents are female, compared to the Maryland average of 69%. Women comprise the large majority, consistent with national assisted living demographics where women live longer and enter care facilities at higher rates. |
95% White Residents — State Benchmarked 95% of residents are reported as White, compared to the Maryland average of 81%. A higher White share than is typical for assisted living in Maryland in this dataset — compare with peer facilities for local context. |
3% African American Residents — State Benchmarked 3% of residents are reported as African American or Black, compared to the Maryland average of 12%. A lower African American share than is typical in Maryland; local markets still vary widely. |
2% Other Ethnicity Residents — State Benchmarked 2% of residents fall into categories other than White or African American (combined), compared to the Maryland average of 7%. This column aggregates Hispanic, Asian, multiracial, and any other labeled groups that are not classified as White or African American. Reported subgroups in this total: Asian (2%). | - |
8% Residents Age 75–84 — State Benchmarked 8% of residents are 75–84, compared to the Maryland average of 31%. Below the state norm — the resident mix may skew either younger or older than this typical middle bracket. |
83% Residents Age 85–94 — State Benchmarked 83% of residents are 85–94, compared to the Maryland average of 44%. A high concentration of very elderly residents signals a higher-acuity facility with experience caring for advanced age-related needs. |
10% Residents Age 95+ — State Benchmarked 10% of residents are 95 or older, compared to the Maryland average of 16%. Most residents here have not yet reached the oldest-old bracket, suggesting a younger overall community. |
| Brightview Mays Chapel Ridge |
MC Memory Care Secured, specialized care for people living with Alzheimer's or dementia. Staff trained in cognitive impairment, with higher staff-to-resident ratios and an environment designed to reduce confusion and wandering risk.
AL Assisted Living A licensed, long-term care setting for seniors or individuals with disabilities who need help with daily activities — like bathing, dressing, and medication management — but not 24-hour skilled nursing. Offers housing, meals, and around-the-clock support while aiming to maximize resident independence.
IL Independent Living Lifestyle-focused communities for older adults offering dining, activities, and transportation with minimal personal care. Best for active, independent seniors who want community without medical support. | Timonium | 89 | No | 52 | Studio / 1 Bed / 2 Bed | 24 | - |
13% Male Residents — State Benchmarked 13% of residents are male, compared to the Maryland average of 31%. This facility caters to a majority female resident pool (87% female), consistent with the broader assisted living trend where women significantly outnumber men. |
87% Female Residents — State Benchmarked 87% of residents are female, compared to the Maryland average of 69%. Women comprise the large majority, consistent with national assisted living demographics where women live longer and enter care facilities at higher rates. |
99% White Residents — State Benchmarked 99% of residents are reported as White, compared to the Maryland average of 81%. A higher White share than is typical for assisted living in Maryland in this dataset — compare with peer facilities for local context. |
0% African American Residents — State Benchmarked 0% of residents are reported as African American or Black, compared to the Maryland average of 12%. A lower African American share than is typical in Maryland; local markets still vary widely. |
1% Other Ethnicity Residents — State Benchmarked 1% of residents fall into categories other than White or African American (combined), compared to the Maryland average of 7%. This column aggregates Hispanic, Asian, multiracial, and any other labeled groups that are not classified as White or African American. Reported subgroups in this total: Asian (1%). |
3% Residents Age 65–74 — State Benchmarked 3% of residents are 65–74, compared to the Maryland average of 12%. Fewer younger seniors suggests the resident population skews older, likely requiring higher acuity care and more hands-on support. |
30% Residents Age 75–84 — State Benchmarked 30% of residents are 75–84, compared to the Maryland average of 31%. This is the second most common age bracket in assisted living, representing residents with moderate care needs. |
48% Residents Age 85–94 — State Benchmarked 48% of residents are 85–94, compared to the Maryland average of 44%. This is typically the most common age bracket in assisted living — this facility is in line with the statewide norm. |
18% Residents Age 95+ — State Benchmarked 18% of residents are 95 or older, compared to the Maryland average of 16%. In line with the statewide profile for the oldest resident bracket. |
| Brightview Crofton Riverwalk |
AL Assisted Living A licensed, long-term care setting for seniors or individuals with disabilities who need help with daily activities — like bathing, dressing, and medication management — but not 24-hour skilled nursing. Offers housing, meals, and around-the-clock support while aiming to maximize resident independence.
IL Independent Living Lifestyle-focused communities for older adults offering dining, activities, and transportation with minimal personal care. Best for active, independent seniors who want community without medical support.
MC Memory Care Secured, specialized care for people living with Alzheimer's or dementia. Staff trained in cognitive impairment, with higher staff-to-resident ratios and an environment designed to reduce confusion and wandering risk.
NH Nursing Home Licensed facility providing 24/7 skilled nursing care for residents with complex, ongoing medical needs. Staffed by RNs, LPNs, and CNAs. Inspected and star-rated annually by CMS. Accepts Medicare (short-term rehab) and Medicaid (long-term care). | Crofton | 92 | Yes | 45 | Studio / 1 Bed / 2 Bed | 6 | - |
27% Male Residents — State Benchmarked 27% of residents are male, compared to the Maryland average of 31%. This facility caters to a majority female resident pool (73% female), consistent with the broader assisted living trend where women significantly outnumber men. |
73% Female Residents — State Benchmarked 73% of residents are female, compared to the Maryland average of 69%. Women comprise the large majority, consistent with national assisted living demographics where women live longer and enter care facilities at higher rates. |
0% White Residents — State Benchmarked 0% of residents are reported as White, compared to the Maryland average of 81%. A lower White share than the Maryland average — the community may draw a more diverse resident mix relative to other facilities in Maryland. |
0% African American Residents — State Benchmarked 0% of residents are reported as African American or Black, compared to the Maryland average of 12%. A lower African American share than is typical in Maryland; local markets still vary widely. |
100% Other Ethnicity Residents — State Benchmarked 100% of residents fall into categories other than White or African American (combined), compared to the Maryland average of 7%. This column aggregates Hispanic, Asian, multiracial, and any other labeled groups that are not classified as White or African American. Reported subgroups in this total: Other (100%). | - | - | - | - |
| Sunrise of Frederick |
AL Assisted Living A licensed, long-term care setting for seniors or individuals with disabilities who need help with daily activities — like bathing, dressing, and medication management — but not 24-hour skilled nursing. Offers housing, meals, and around-the-clock support while aiming to maximize resident independence.
HC Home Care Professional care delivered in the person's own home — from companionship and errands to skilled nursing and therapy. Allows seniors to age in place. Medicare covers skilled home health when medically necessary.
HC Home Care Professional care delivered in the person's own home — from companionship and errands to skilled nursing and therapy. Allows seniors to age in place. Medicare covers skilled home health when medically necessary.
IL Independent Living Lifestyle-focused communities for older adults offering dining, activities, and transportation with minimal personal care. Best for active, independent seniors who want community without medical support.
MC Memory Care Secured, specialized care for people living with Alzheimer's or dementia. Staff trained in cognitive impairment, with higher staff-to-resident ratios and an environment designed to reduce confusion and wandering risk.
NH Nursing Home Licensed facility providing 24/7 skilled nursing care for residents with complex, ongoing medical needs. Staffed by RNs, LPNs, and CNAs. Inspected and star-rated annually by CMS. Accepts Medicare (short-term rehab) and Medicaid (long-term care). | Frederick (Waterford) | 88 | Yes | 62 | Studio / Suite / 2 Bed | 34 | A- |
31% Male Residents — State Benchmarked 31% of residents are male, compared to the Maryland average of 31%. This facility caters to a majority female resident pool (69% female), consistent with the broader assisted living trend where women significantly outnumber men. |
69% Female Residents — State Benchmarked 69% of residents are female, compared to the Maryland average of 69%. Women comprise the large majority, consistent with national assisted living demographics where women live longer and enter care facilities at higher rates. |
97% White Residents — State Benchmarked 97% of residents are reported as White, compared to the Maryland average of 81%. A higher White share than is typical for assisted living in Maryland in this dataset — compare with peer facilities for local context. |
2% African American Residents — State Benchmarked 2% of residents are reported as African American or Black, compared to the Maryland average of 12%. A lower African American share than is typical in Maryland; local markets still vary widely. |
2% Other Ethnicity Residents — State Benchmarked 2% of residents fall into categories other than White or African American (combined), compared to the Maryland average of 7%. This column aggregates Hispanic, Asian, multiracial, and any other labeled groups that are not classified as White or African American. Reported subgroups in this total: Hispanic (2%). |
10% Residents Age 65–74 — State Benchmarked 10% of residents are 65–74, compared to the Maryland average of 12%. In line with the statewide profile for this youngest senior bracket in assisted living. |
34% Residents Age 75–84 — State Benchmarked 34% of residents are 75–84, compared to the Maryland average of 31%. This is the second most common age bracket in assisted living, representing residents with moderate care needs. |
48% Residents Age 85–94 — State Benchmarked 48% of residents are 85–94, compared to the Maryland average of 44%. This is typically the most common age bracket in assisted living — this facility is in line with the statewide norm. |
6% Residents Age 95+ — State Benchmarked 6% of residents are 95 or older, compared to the Maryland average of 16%. Most residents here have not yet reached the oldest-old bracket, suggesting a younger overall community. |
| Sunrise of Rockville |
AL Assisted Living A licensed, long-term care setting for seniors or individuals with disabilities who need help with daily activities — like bathing, dressing, and medication management — but not 24-hour skilled nursing. Offers housing, meals, and around-the-clock support while aiming to maximize resident independence. | Rockville | 89 | Yes | 89 | Studio / 1 Bed / 2 Bed | 28 | A- |
23% Male Residents — State Benchmarked 23% of residents are male, compared to the Maryland average of 31%. This facility caters to a majority female resident pool (77% female), consistent with the broader assisted living trend where women significantly outnumber men. |
77% Female Residents — State Benchmarked 77% of residents are female, compared to the Maryland average of 69%. Women comprise the large majority, consistent with national assisted living demographics where women live longer and enter care facilities at higher rates. |
87% White Residents — State Benchmarked 87% of residents are reported as White, compared to the Maryland average of 81%. Close to the average for this category among assisted living facilities in Maryland with reported race/ethnicity data. |
2% African American Residents — State Benchmarked 2% of residents are reported as African American or Black, compared to the Maryland average of 12%. A lower African American share than is typical in Maryland; local markets still vary widely. |
11% Other Ethnicity Residents — State Benchmarked 11% of residents fall into categories other than White or African American (combined), compared to the Maryland average of 7%. This column aggregates Hispanic, Asian, multiracial, and any other labeled groups that are not classified as White or African American. Reported subgroups in this total: Mixed Race (6%), Hispanic (3%), Asian (2%). |
3% Residents Age 65–74 — State Benchmarked 3% of residents are 65–74, compared to the Maryland average of 12%. Fewer younger seniors suggests the resident population skews older, likely requiring higher acuity care and more hands-on support. |
31% Residents Age 75–84 — State Benchmarked 31% of residents are 75–84, compared to the Maryland average of 31%. This is the second most common age bracket in assisted living, representing residents with moderate care needs. |
56% Residents Age 85–94 — State Benchmarked 56% of residents are 85–94, compared to the Maryland average of 44%. A high concentration of very elderly residents signals a higher-acuity facility with experience caring for advanced age-related needs. |
10% Residents Age 95+ — State Benchmarked 10% of residents are 95 or older, compared to the Maryland average of 16%. Most residents here have not yet reached the oldest-old bracket, suggesting a younger overall community. |
| Arbor Terrace at Waugh Chapel |
AL Assisted Living A licensed, long-term care setting for seniors or individuals with disabilities who need help with daily activities — like bathing, dressing, and medication management — but not 24-hour skilled nursing. Offers housing, meals, and around-the-clock support while aiming to maximize resident independence.
MC Memory Care Secured, specialized care for people living with Alzheimer's or dementia. Staff trained in cognitive impairment, with higher staff-to-resident ratios and an environment designed to reduce confusion and wandering risk. | Gambrills | 96 | No | 47 | - | 7 | A+ |
30% Male Residents — State Benchmarked 30% of residents are male, compared to the Maryland average of 31%. This facility caters to a majority female resident pool (70% female), consistent with the broader assisted living trend where women significantly outnumber men. |
70% Female Residents — State Benchmarked 70% of residents are female, compared to the Maryland average of 69%. Women comprise the large majority, consistent with national assisted living demographics where women live longer and enter care facilities at higher rates. |
86% White Residents — State Benchmarked 86% of residents are reported as White, compared to the Maryland average of 81%. Close to the average for this category among assisted living facilities in Maryland with reported race/ethnicity data. |
12% African American Residents — State Benchmarked 12% of residents are reported as African American or Black, compared to the Maryland average of 12%. In line with the Maryland average for African American residents among facilities reporting this breakdown. |
3% Other Ethnicity Residents — State Benchmarked 3% of residents fall into categories other than White or African American (combined), compared to the Maryland average of 7%. This column aggregates Hispanic, Asian, multiracial, and any other labeled groups that are not classified as White or African American. Reported subgroups in this total: Asian (1%), Hawaiian/Pacific Islander (1%). |
10% Residents Age 65–74 — State Benchmarked 10% of residents are 65–74, compared to the Maryland average of 12%. In line with the statewide profile for this youngest senior bracket in assisted living. |
43% Residents Age 75–84 — State Benchmarked 43% of residents are 75–84, compared to the Maryland average of 31%. A high concentration in this mid-range bracket, where residents typically need moderate support with daily activities. |
39% Residents Age 85–94 — State Benchmarked 39% of residents are 85–94, compared to the Maryland average of 44%. This is typically the most common age bracket in assisted living — this facility is in line with the statewide norm. |
8% Residents Age 95+ — State Benchmarked 8% of residents are 95 or older, compared to the Maryland average of 16%. Most residents here have not yet reached the oldest-old bracket, suggesting a younger overall community. |
| Celebration Villa of Manresa |
AL Assisted Living A licensed, long-term care setting for seniors or individuals with disabilities who need help with daily activities — like bathing, dressing, and medication management — but not 24-hour skilled nursing. Offers housing, meals, and around-the-clock support while aiming to maximize resident independence.
RC Respite Care Short-term temporary care — days to weeks — to give family caregivers a break. Full care provided during the stay. Often used after hospitalization or to trial a facility before a permanent placement decision. | Annapolis | 86 | Yes | 2 | Studio / 1 Bed | 3 | - |
35% Male Residents — State Benchmarked 35% of residents are male, compared to the Maryland average of 31%. This facility caters to a majority female resident pool (65% female), consistent with the broader assisted living trend where women significantly outnumber men. |
65% Female Residents — State Benchmarked 65% of residents are female, compared to the Maryland average of 69%. Women comprise the large majority, consistent with national assisted living demographics where women live longer and enter care facilities at higher rates. |
97% White Residents — State Benchmarked 97% of residents are reported as White, compared to the Maryland average of 81%. A higher White share than is typical for assisted living in Maryland in this dataset — compare with peer facilities for local context. |
3% African American Residents — State Benchmarked 3% of residents are reported as African American or Black, compared to the Maryland average of 12%. A lower African American share than is typical in Maryland; local markets still vary widely. |
0% Other Ethnicity Residents — State Benchmarked 0% of residents fall into categories other than White or African American (combined), compared to the Maryland average of 7%. This column aggregates Hispanic, Asian, multiracial, and any other labeled groups that are not classified as White or African American. |
8% Residents Age 65–74 — State Benchmarked 8% of residents are 65–74, compared to the Maryland average of 12%. Fewer younger seniors suggests the resident population skews older, likely requiring higher acuity care and more hands-on support. |
52% Residents Age 75–84 — State Benchmarked 52% of residents are 75–84, compared to the Maryland average of 31%. A high concentration in this mid-range bracket, where residents typically need moderate support with daily activities. |
27% Residents Age 85–94 — State Benchmarked 27% of residents are 85–94, compared to the Maryland average of 44%. The population here skews younger than the statewide norm, which may indicate a more active, lower-acuity community. |
13% Residents Age 95+ — State Benchmarked 13% of residents are 95 or older, compared to the Maryland average of 16%. In line with the statewide profile for the oldest resident bracket. |
| Queenstown Landing |
AL Assisted Living A licensed, long-term care setting for seniors or individuals with disabilities who need help with daily activities — like bathing, dressing, and medication management — but not 24-hour skilled nursing. Offers housing, meals, and around-the-clock support while aiming to maximize resident independence. | Baltimore | 78 | No | 10 | - | 5 | - |
35% Male Residents — State Benchmarked 35% of residents are male, compared to the Maryland average of 31%. This facility caters to a majority female resident pool (65% female), consistent with the broader assisted living trend where women significantly outnumber men. |
65% Female Residents — State Benchmarked 65% of residents are female, compared to the Maryland average of 69%. Women comprise the large majority, consistent with national assisted living demographics where women live longer and enter care facilities at higher rates. |
98% White Residents — State Benchmarked 98% of residents are reported as White, compared to the Maryland average of 81%. A higher White share than is typical for assisted living in Maryland in this dataset — compare with peer facilities for local context. |
2% African American Residents — State Benchmarked 2% of residents are reported as African American or Black, compared to the Maryland average of 12%. A lower African American share than is typical in Maryland; local markets still vary widely. |
0% Other Ethnicity Residents — State Benchmarked 0% of residents fall into categories other than White or African American (combined), compared to the Maryland average of 7%. This column aggregates Hispanic, Asian, multiracial, and any other labeled groups that are not classified as White or African American. | - |
5% Residents Age 75–84 — State Benchmarked 5% of residents are 75–84, compared to the Maryland average of 31%. Below the state norm — the resident mix may skew either younger or older than this typical middle bracket. |
88% Residents Age 85–94 — State Benchmarked 88% of residents are 85–94, compared to the Maryland average of 44%. A high concentration of very elderly residents signals a higher-acuity facility with experience caring for advanced age-related needs. |
7% Residents Age 95+ — State Benchmarked 7% of residents are 95 or older, compared to the Maryland average of 16%. Most residents here have not yet reached the oldest-old bracket, suggesting a younger overall community. |
| Arbor Terrace Waugh Chapel |
MC Memory Care Secured, specialized care for people living with Alzheimer's or dementia. Staff trained in cognitive impairment, with higher staff-to-resident ratios and an environment designed to reduce confusion and wandering risk.
AL Assisted Living A licensed, long-term care setting for seniors or individuals with disabilities who need help with daily activities — like bathing, dressing, and medication management — but not 24-hour skilled nursing. Offers housing, meals, and around-the-clock support while aiming to maximize resident independence. | Gambrills | 96 | Yes | 47 | Studio / 1 Bed / 2 Bed | 7 | A+ |
30% Male Residents — State Benchmarked 30% of residents are male, compared to the Maryland average of 31%. This facility caters to a majority female resident pool (70% female), consistent with the broader assisted living trend where women significantly outnumber men. |
70% Female Residents — State Benchmarked 70% of residents are female, compared to the Maryland average of 69%. Women comprise the large majority, consistent with national assisted living demographics where women live longer and enter care facilities at higher rates. |
86% White Residents — State Benchmarked 86% of residents are reported as White, compared to the Maryland average of 81%. Close to the average for this category among assisted living facilities in Maryland with reported race/ethnicity data. |
12% African American Residents — State Benchmarked 12% of residents are reported as African American or Black, compared to the Maryland average of 12%. In line with the Maryland average for African American residents among facilities reporting this breakdown. |
3% Other Ethnicity Residents — State Benchmarked 3% of residents fall into categories other than White or African American (combined), compared to the Maryland average of 7%. This column aggregates Hispanic, Asian, multiracial, and any other labeled groups that are not classified as White or African American. Reported subgroups in this total: Asian (1%), Hawaiian/Pacific Islander (1%). |
10% Residents Age 65–74 — State Benchmarked 10% of residents are 65–74, compared to the Maryland average of 12%. In line with the statewide profile for this youngest senior bracket in assisted living. |
43% Residents Age 75–84 — State Benchmarked 43% of residents are 75–84, compared to the Maryland average of 31%. A high concentration in this mid-range bracket, where residents typically need moderate support with daily activities. |
39% Residents Age 85–94 — State Benchmarked 39% of residents are 85–94, compared to the Maryland average of 44%. This is typically the most common age bracket in assisted living — this facility is in line with the statewide norm. |
8% Residents Age 95+ — State Benchmarked 8% of residents are 95 or older, compared to the Maryland average of 16%. Most residents here have not yet reached the oldest-old bracket, suggesting a younger overall community. |
| Brookdale Olney |
AL Assisted Living A licensed, long-term care setting for seniors or individuals with disabilities who need help with daily activities — like bathing, dressing, and medication management — but not 24-hour skilled nursing. Offers housing, meals, and around-the-clock support while aiming to maximize resident independence.
MC Memory Care Secured, specialized care for people living with Alzheimer's or dementia. Staff trained in cognitive impairment, with higher staff-to-resident ratios and an environment designed to reduce confusion and wandering risk. | Olney | 94 | Yes | 16 | Studio / 1 Bed / 2 Bed | 13 | - |
33% Male Residents — State Benchmarked 33% of residents are male, compared to the Maryland average of 31%. This facility caters to a majority female resident pool (67% female), consistent with the broader assisted living trend where women significantly outnumber men. |
67% Female Residents — State Benchmarked 67% of residents are female, compared to the Maryland average of 69%. Women comprise the large majority, consistent with national assisted living demographics where women live longer and enter care facilities at higher rates. |
94% White Residents — State Benchmarked 94% of residents are reported as White, compared to the Maryland average of 81%. A higher White share than is typical for assisted living in Maryland in this dataset — compare with peer facilities for local context. |
3% African American Residents — State Benchmarked 3% of residents are reported as African American or Black, compared to the Maryland average of 12%. A lower African American share than is typical in Maryland; local markets still vary widely. |
3% Other Ethnicity Residents — State Benchmarked 3% of residents fall into categories other than White or African American (combined), compared to the Maryland average of 7%. This column aggregates Hispanic, Asian, multiracial, and any other labeled groups that are not classified as White or African American. Reported subgroups in this total: Asian (3%). |
8% Residents Age 65–74 — State Benchmarked 8% of residents are 65–74, compared to the Maryland average of 12%. Fewer younger seniors suggests the resident population skews older, likely requiring higher acuity care and more hands-on support. |
39% Residents Age 75–84 — State Benchmarked 39% of residents are 75–84, compared to the Maryland average of 31%. A high concentration in this mid-range bracket, where residents typically need moderate support with daily activities. |
22% Residents Age 85–94 — State Benchmarked 22% of residents are 85–94, compared to the Maryland average of 44%. The population here skews younger than the statewide norm, which may indicate a more active, lower-acuity community. |
28% Residents Age 95+ — State Benchmarked 28% of residents are 95 or older, compared to the Maryland average of 16%. A high proportion of the oldest-old suggests strong end-of-life care experience and very-high-acuity capabilities. |
| Charter Senior Living of Towson |
MC Memory Care Secured, specialized care for people living with Alzheimer's or dementia. Staff trained in cognitive impairment, with higher staff-to-resident ratios and an environment designed to reduce confusion and wandering risk.
AL Assisted Living A licensed, long-term care setting for seniors or individuals with disabilities who need help with daily activities — like bathing, dressing, and medication management — but not 24-hour skilled nursing. Offers housing, meals, and around-the-clock support while aiming to maximize resident independence. | Baltimore | 92 | No | 36 | Studio / 1 Bed | 5 | - |
25% Male Residents — State Benchmarked 25% of residents are male, compared to the Maryland average of 31%. This facility caters to a majority female resident pool (75% female), consistent with the broader assisted living trend where women significantly outnumber men. |
75% Female Residents — State Benchmarked 75% of residents are female, compared to the Maryland average of 69%. Women comprise the large majority, consistent with national assisted living demographics where women live longer and enter care facilities at higher rates. |
88% White Residents — State Benchmarked 88% of residents are reported as White, compared to the Maryland average of 81%. Close to the average for this category among assisted living facilities in Maryland with reported race/ethnicity data. |
7% African American Residents — State Benchmarked 7% of residents are reported as African American or Black, compared to the Maryland average of 12%. In line with the Maryland average for African American residents among facilities reporting this breakdown. |
4% Other Ethnicity Residents — State Benchmarked 4% of residents fall into categories other than White or African American (combined), compared to the Maryland average of 7%. This column aggregates Hispanic, Asian, multiracial, and any other labeled groups that are not classified as White or African American. Reported subgroups in this total: Asian (3%), Hispanic (1%). | - |
22% Residents Age 75–84 — State Benchmarked 22% of residents are 75–84, compared to the Maryland average of 31%. Below the state norm — the resident mix may skew either younger or older than this typical middle bracket. |
60% Residents Age 85–94 — State Benchmarked 60% of residents are 85–94, compared to the Maryland average of 44%. A high concentration of very elderly residents signals a higher-acuity facility with experience caring for advanced age-related needs. |
15% Residents Age 95+ — State Benchmarked 15% of residents are 95 or older, compared to the Maryland average of 16%. In line with the statewide profile for the oldest resident bracket. |
Rows per page:

View all Nearby Homes
Overview of Artis Senior Living of Potomac


Located in the stunning community of Bethesda, MD, the Artis Senior Living of Potomac is a vibrant community that offers assisted living and memory care services. Here, residents can choose among furnished suites with several floor plans tailored to their preferences. This community provides a wide array of features and services including a 24-hour on-site licensed nurse, 10, 000+ sq. ft. of secure indoor space, a quiet residential neighborhood, and a scenic view of Cabin John Creek & Trails. As for memory care, it offers dementia-specific community design for those with cognitive conditions.
Embrace its top-tier amenities wherein residents can enjoy delightful and healthy chef-prepared meals, an art studio, a barbershop, and a beauty salon. Meet new people and create lasting memories through various physical and social activities at the program and wellness centers. Equipped with the right tools and people, seniors can live an all-encompassing life with Artis Senior Living of Potomac.
What does this home offer?
Staff to Resident Ratio: Suite
Transportation Services
Fitness and Recreation
Overview of Brightview Fallsgrove
Located within the charming Rockville, Maryland, Brightview Fallsgrove offers a captivating blend of assisted living and memory care services, making it a beacon of exceptional care for seniors. Its enchanting surroundings are adorned with an on-site conservation area, highlighted by the presence of Rockville’s oldest tree, creating a tranquil atmosphere. Serenity beckons with winding walking paths, while the community boasts additional delights such as a cozy Café and a well-stocked library. The calendar brims with a myriad of engaging events, inviting residents to embrace a vibrant and fulfilling lifestyle. Notably, an on-site public art gallery adds an extra touch of cultural enrichment to the community’s offerings.
With a rich history spanning over two decades, Brightview Fallsgrove has become synonymous with trust and expertise in senior living. Its distinguished reputation is a testament to its enduring commitment to providing top-notch amenities and services, each designed to cater to the unique preferences of its cherished residents. From its stunning environment to its thoughtfully curated events and unwavering dedication to seniors’ well-being, Brightview Fallsgrove stands as a true haven of comfort, where every detail is carefully orchestrated to ensure a life enriched with fulfillment.
What does this home offer?
Housing Options: Studio / 1 Bed
Building Type: 3-story
Transportation Services
Fitness and Recreation
Overview of Brightview Catonsville
Brightview Catonsville is a vibrant senior living community located in the heart of Catonsville, Maryland. With a focus on independent living, assisted living, and memory care services, this community provides a nurturing and engaging environment for seniors. The modern and well-appointed apartments offer a comfortable and private living space, while the numerous communal areas provide opportunities for socializing and participating in a variety of activities. The dedicated staff at Brightview Catonsville is available 24/7 to provide personalized care and support, ensuring that each resident’s unique needs are met with compassion and professionalism.
Brightview Catonsville is known for its extensive amenities and enriching programs. Residents can enjoy delicious meals prepared by skilled chefs in the elegant dining room, as well as engage in a wide range of activities, including fitness classes, arts and crafts, educational seminars, and social outings. The community is surrounded by beautifully landscaped grounds, including outdoor patios and walking paths, where residents can relax and enjoy nature. With a commitment to providing a vibrant and fulfilling lifestyle, Brightview Catonsville offers seniors a welcoming community where they can thrive and enjoy their golden years to the fullest.
What does this home offer?
Pets Allowed: Yes, Pets Allowed
Housing Options: Studio / 1 Bed / 2 Bed
Building Type: 3-story
Transportation Services
Fitness and Recreation
Sunrise of Bethesda is a senior living community situated in an ideal location in Bethesda, Maryland, just steps from the Bethesda Trolley Trail and Battery Park. The community offers a personalized lifestyle where they cater to each resident’s unique needs and desires. Room rates start at $4,530 per month, and the community provides assisted living and memory care services led by experienced team members who are trained to provide individualized care. Residents living with Alzheimer’s and other forms of dementia benefit from evidence-based, compassionate care in the Terrace Club Neighborhood and Reminiscence Neighborhood.
The community features a 9-story building with monthly rentals available for various floor plans, including studio, companion, one-bedroom, and two-bedroom apartments. Residents enjoy a packed calendar of activities, seasonal meals prepared by an in-house chef, and access to a therapeutic music app. Conveniently located near shopping, dining, theaters, and medical facilities, Sunrise of Bethesda offers a vibrant and supportive living experience. With its ideal location, personalized care, and engaging amenities, the community provides a fulfilling retirement for seniors in the Bethesda area.
What does this home offer?
Pets Allowed: Yes, Pets Allowed
Housing Options: Studio / 1 Bed / 2 Bed
Building Type: Mid-rise
Transportation Services
Fitness and Recreation
Introducing Sunrise at Fox Hill, the premier community offered by Sunrise Senior Living. Nestled in a prime location with easy access to Washington, DC, and northern Virginia, this community is a favorite among residents and families. Just minutes away from downtown Bethesda’s vibrant shops, restaurants, and cultural activities, it offers the perfect blend of convenience and excitement.
At Fox Hill Assisted Living, residents receive highly personalized care and support within a professionally managed and thoughtfully designed environment. It serves as an ideal option for seniors seeking independence while having access to a dedicated care and nursing team available around the clock. From assisting with daily activities like bathing, dressing, and mobility to providing the peace of mind that comes with 24-hour standby care, their focus is on holistic wellness and promoting residents’ independence. With beautifully appointed living spaces, delectable meals, engaging social activities, transportation services, and personalized assistance, including a full-time concierge, Fox Hill ensures a tailored plan of assistance that meets each resident’s unique needs.
What does this home offer?
Pets Allowed: Yes, Pets Allowed
Housing Options: Studio / Suite / 1 Bed
Building Type: Mid-rise
Transportation Services
Fitness and Recreation
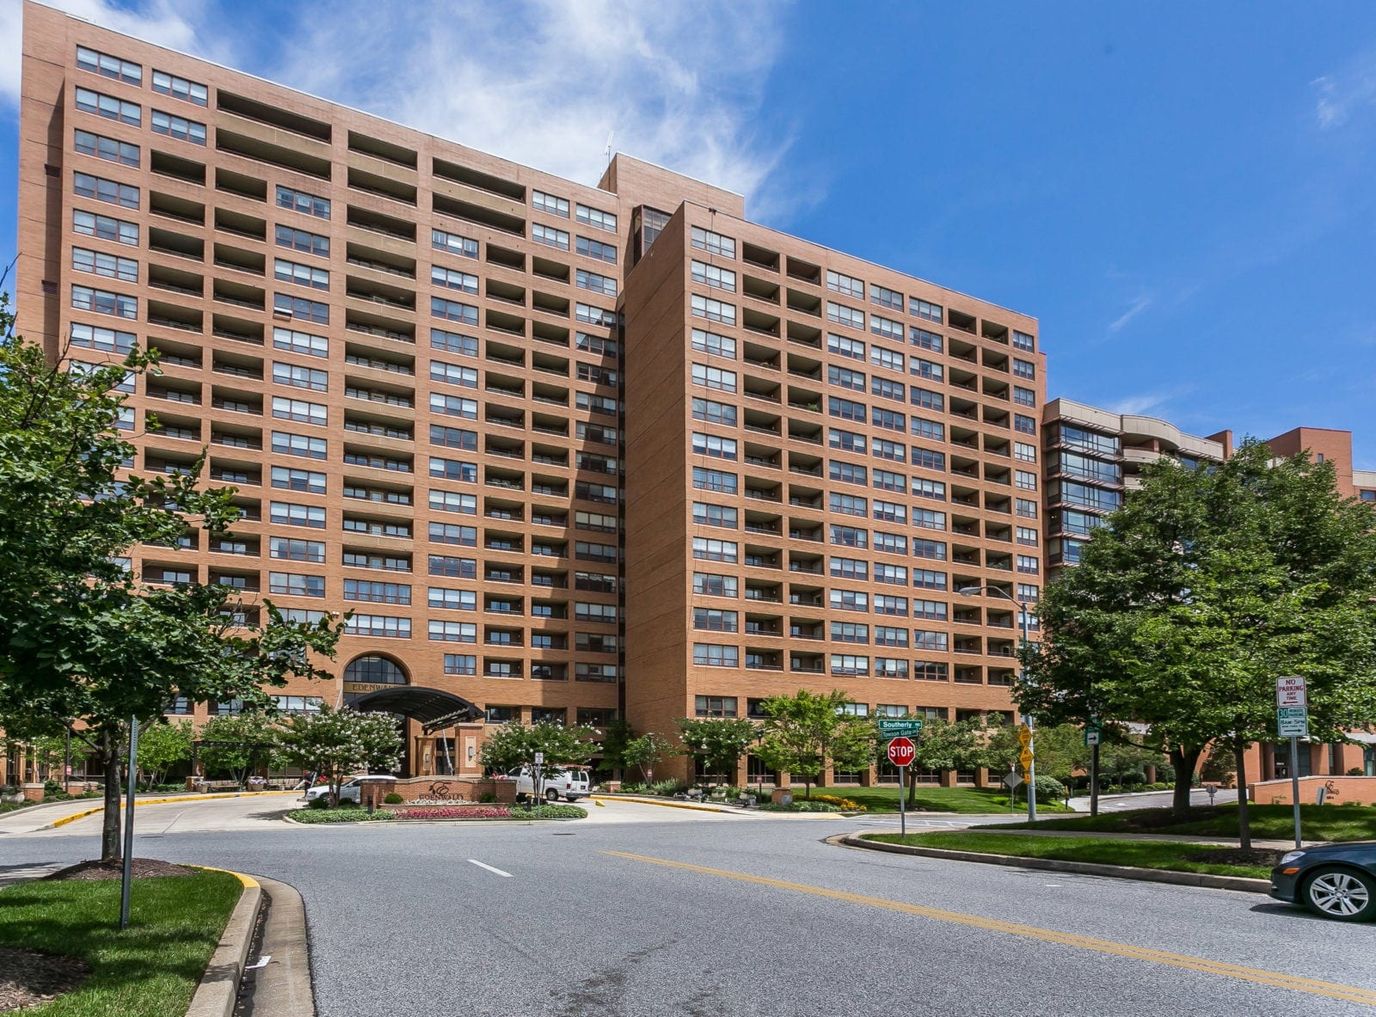
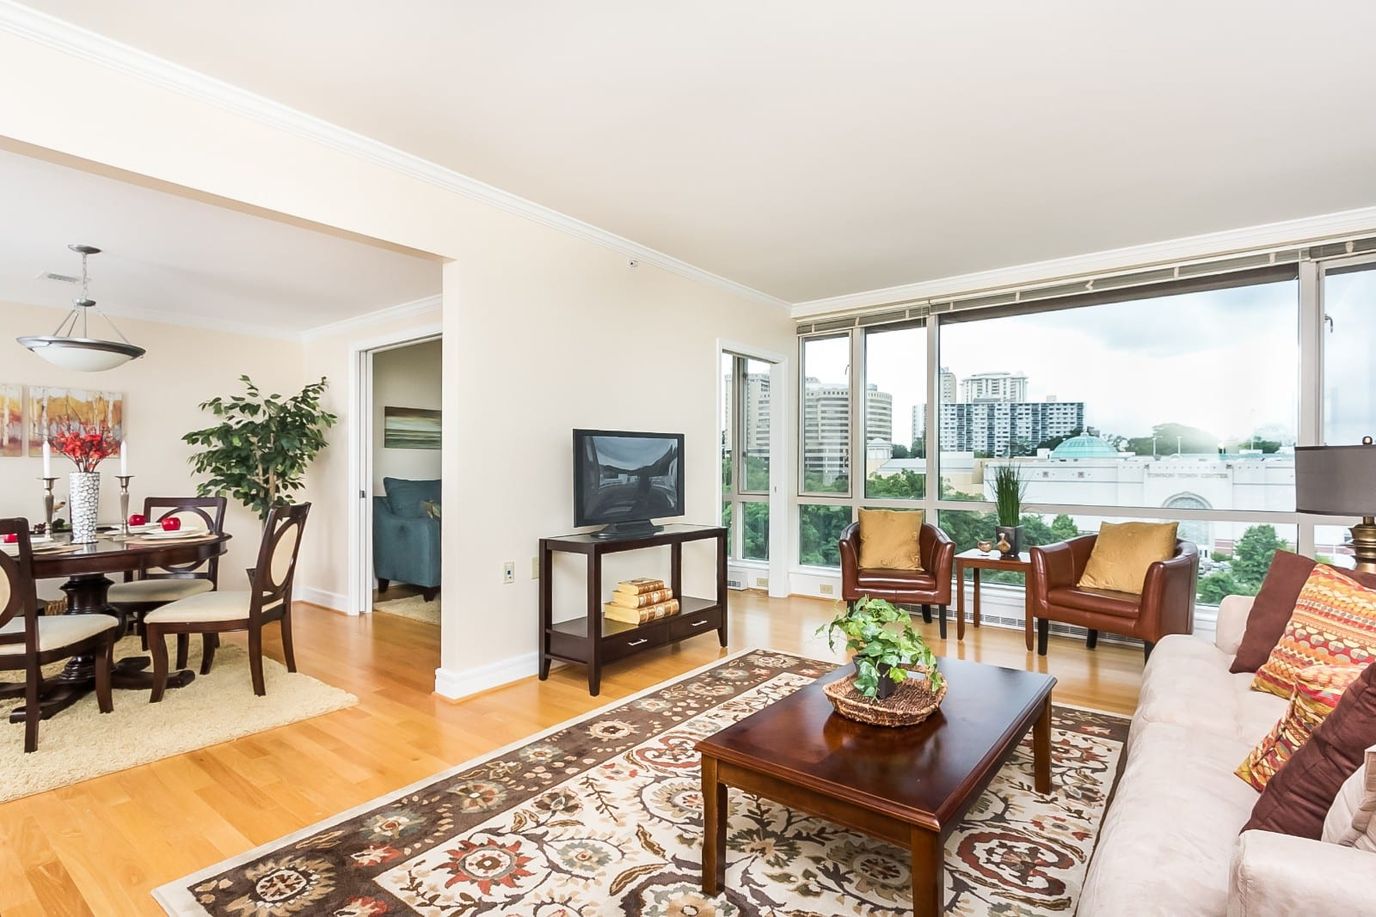
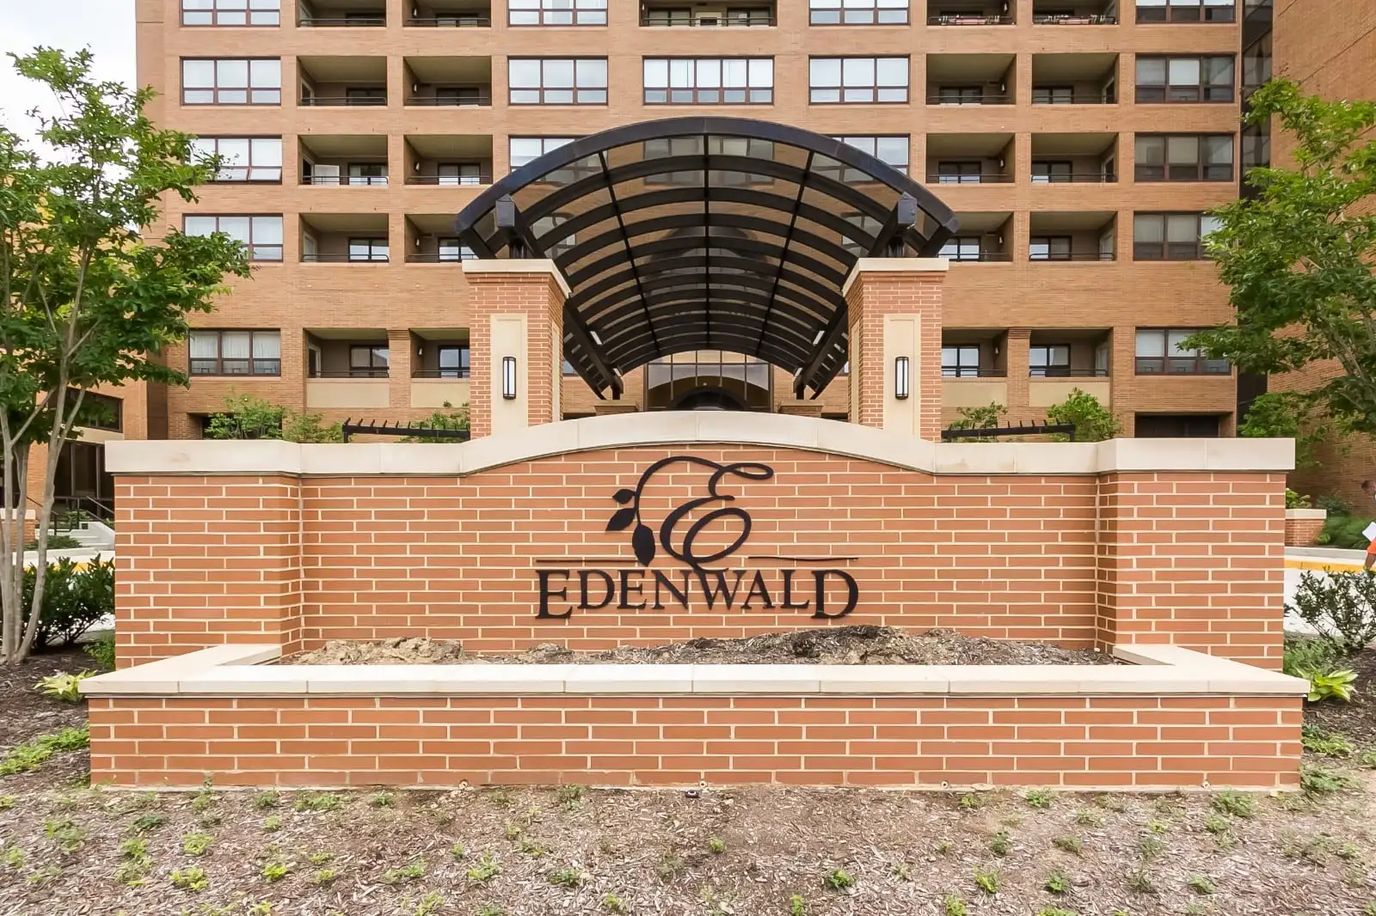
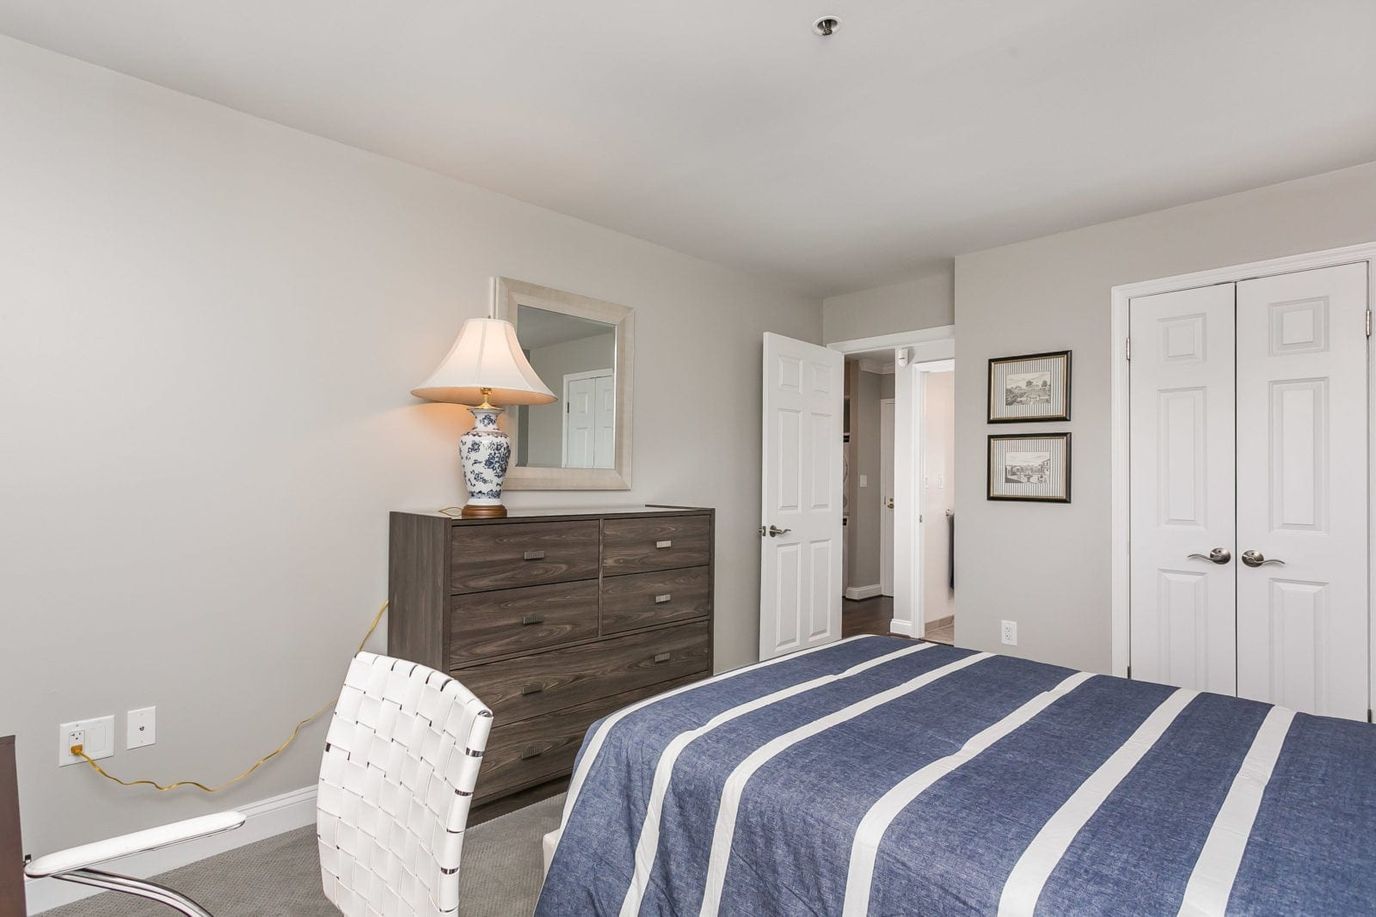
Overview of Edenwald Senior Living
Live your best years at Edenwald Senior Living, an esteemed community in Towson, MD, offering independent living. The community also provides assisted living, memory care, and nursing care, ensuring residents can easily access healthcare when needs arise. Residents also enjoy hassle-free living with maintenance services and plenty of convenient apartment features.
A well-thought-out calendar of engaging activities and enriching programs is conducted, encouraging residents to live actively and make new friends. Residents have the finest dining experience with multiple dining venues that cater to their dietary needs and preferences. The community is ideal for those seeking independence in retirement, especially with its vibrant and welcoming environment.
What does this home offer?
Housing Options: 1 Bed / 2 Bed
Building Type: High-rise
Dining Services
Beauty Services
Transportation Services
Housekeeping Services
Social and Recreational Activities
Exercise Programs
Swimming Pool
Overview of Olney Memory Care by Artis
A one-of-a-kind community quietly set in Georgia Avenue, Olney, MD, Olney Memory Care by Artis specializes in memory care. Collaborating with a team of respectful and highly qualified professionals, the community provides top-tier care and assistance around the clock tailored to residents’ memory-related needs. Here, residents ease their worries with the community helping with their daily living activities, housekeeping, linens, and laundry.
With a well-thought-out calendar of stimulating programs and engaging events, residents retain social connections and live with purpose. From breakfast to dinner, residents do not have to worry about mealtimes with the dietitian-approved meals that satisfy dietary needs and preferences. The community also provides medication management, incontinence care, behavioral and emotional health support, and mobility assistance, to meet residents’ healthcare needs. Cherish every moment of your golden years within the community’s 10,000 square feet of serene spaces and tranquil walking paths.
What does this home offer?
Housing Options: Studio / Suite
Building Type: Single-story
Dining Services
Beauty Services
Transportation Services
Housekeeping Services
Recreational Activities
Exercise Programs
Overview of Brightview Bethesda Grosvenor
Overlooking the beautiful community of North Bethesda, MD, the Brightview Bethesda Grosvernor is a peculiar senior living community providing assisted living, memory care, and enhanced care services. Cozy and beautifully appointed accommodations including deluxe styles are available for its residents. With an expert and empathetic team, this community offers high-quality and innovative memory care services for those with cognitive conditions like dementia.
Having top-of-the-line amenities and services, residents can enjoy chef-prepared meals, a beauty salon, a fitness center with state-of-the-art senior-friendly equipment, etc. Meet new friends by visiting its common spaces like the upscale pub and outdoor gardens. Engage in a full calendar, diverse programs, and activities to boost social engagement and life enrichment. At Brightview Bethesda Grosvenor, seniors are assured of a living experience worth remembering.
What does this home offer?
Housing Options: Deluxe Apartments
Building Type: Mid-rise
Fitness and Recreation
Overview of Brightview Towson
Brightview Towson is a leading senior living community, located in Towson, MD, offering assisted living, dementia care, and enhanced care. Residents can choose from a studio, one or two bedroom apartments with well-designed kitchenette, lots of closet space, and bathrooms designed with seniors’ safety and comfort in mind. The community features a dedicated Health Services Director that works closely with residents and their families in creating individualized care plans that comprehensively address residents’ unique needs.
Residents dealing with the challenges of memory loss are provided with a secure neighborhood designed to foster independence, participation in social programs that are tailored to their abilities, interests and gifts, and be cared for by an exceptional care team. Additionally, the community offers an array of convenient amenities that foster social engagement, enjoyment, and fulfilling living experiences. Dining is an enjoyable experience with carefully prepared meals tailored to residents’ unique tastes and dietary needs.
What does this home offer?
Housing Options: Studio / 1 Bed / 2 Bed
Building Type: Mid-rise
Transportation Services
Fitness and Recreation
Overview of The Terraces at Tuckerman Lane
Nestled within the peaceful neighborhood of North Bethesda, Maryland, lies The Terraces at Tuckerman Lane—a home where residents are embraced by a community that radiates unwavering support. The Terraces prides itself on providing exceptional care through a range of specialized programs, including assisted living, memory care, and respite care. Regular visits from experienced physicians further enhance the well-being of residents, guaranteeing top-quality healthcare that is always within reach. Furthermore, specialized support is available for postoperative care, pain management, and other specific needs, ensuring comprehensive care throughout every step of the journey.
Transparency is a core value at The Terraces at Tuckerman Lane. With their all-inclusive pricing model, residents and their families gain peace of mind through the community’s offerings, eliminating any uncertainties. Culinary experiences here are exceptional, with skilled chefs preparing delectable meals that cater to individual preferences and dietary needs. State-of-the-art technology seamlessly integrates into daily life, offering innovative solutions tailored to the unique requirements of residents. Beyond exceptional care, the community also offers an array of enriching amenities, including a cozy library, a serene chapel, and a well-equipped computer center, fostering personal growth and meaningful relationships.
Assisted Living Magazine Ranking Methodology
View Full Ranking MethodologyHow Assisted Living Magazine Evaluates & Scores Nursing Homes
Assisted Living Magazine ranks nursing homes using a rigorous, data-driven scoring model built specifically for skilled nursing.
Because this care level is regulated, clinical outcomes and compliance carry significantly more weight than transparency or digital presence.
Each community receives a ranking based on the factors below, weighted according to their importance in predicting resident safety, care quality, and long-term stability.
Update cadence: Reviewed quarterly, with prompt updates when new reviews, reports, or complaints are filed.
What We Prioritize Most
Operational Stability & Resident SupportThe largest share of every nursing home’s score — 45% of the total weighting — comes from clinical and regulatory indicators, including:
-
 Overall, staffing, and inspection ratings
 -
 Long-stay and short-stay quality measures
 -
 Nurse-to-resident and staff-to-resident ratios
 - Health deficiencies and regulatory history
- Accreditations and positive local news reporting
These factors directly reflect resident safety, care quality, and compliance.
Another 35% of the score comes from operational and stability signals, such as:
- Nurse hours per patient per day
- Occupancy levels and cleanliness citations
- Administrative stability and ownership quality
- Readmission rates and registered-nurse turnover
The remaining 20% of the score includes contextual elements such as:
- Year built or renovated
- Penalties, fines, and preventable readmissions
- Revenue per bed
- Administrator tenure
These factors help round out the overall picture but carry less weight because our methodology prioritizes clinical outcomes and regulatory consistency above all else.
The result is a clear, data-driven ranking system that elevates nursing homes delivering exceptional care and long-term resident safety.
Nearby Cities
Who we are
Your Senior Care Partner, Every Step of the Way
We help families find affordable senior communities and unlock same day discounts, Medicaid, and Medicare options tailored to your needs.
Contact us Today
Frequently Asked Questions
What government services provide money for senior housing?
Several government programs offer financial assistance for senior housing in various countries, focusing on the United States for a broad overview:
- Medicaid: Medicaid is a state and federally funded program that can cover the costs of nursing home care for those who meet eligibility criteria, including income and asset limits. Some states also offer Medicaid waivers that help pay for home and community-based services to prevent or delay nursing home placement.
- Medicare: Medicare, primarily a health insurance program for people aged 65 and over, does not cover long-term housing costs. However, it can cover short-term stays in a skilled nursing facility under specific conditions following a hospital stay.
- Section 202 Supportive Housing for the Elderly Program: This program provides housing for low-income seniors. It offers rental assistance and access to supportive services, such as cleaning, cooking, and transportation.
- Low-Income Housing Tax Credit (LIHTC) Properties: While not a direct subsidy, LIHTC encourages developers to create affordable housing. Seniors with low incomes can find reduced-rent apartments through this program.
- State and Local Programs: Many states, counties, and cities offer their own programs to assist seniors with housing costs. These can include property tax relief programs, rental assistance programs, and programs that offer affordable senior housing options.
- Veterans Affairs (VA): The VA offers several programs for veterans, including the Aid and Attendance benefit, which provides monthly payments to veterans who require the aid of another person, or are housebound, to help cover the cost of care in homes, nursing homes, and assisted living facilities.
- Social Security: While Social Security primarily provides retirement income, for many seniors, these benefits are a crucial part of their budget, including housing costs.
How do you pick the homes you recommend?
Before recommending homes, we conduct a thorough evaluation on crucial factors that define a senior home such as the quality of care they provide, the reputation of the organization, and a comprehensive review of community testimonials as well. Every detail is assessed to assure that seniors are offered not just senior care options, but trustworthy homes where they can experience the care that they deserve.
Do you help families that need Medicaid?
Yes. Assisting families who need Medicaid is important to us as it plays a crucial role in offering financial support to seniors confronting economic challenges. We would like to keep essential healthcare services accessible to all community members, irrespective of one’s financial circumstances.
How much does this service cost?
We extend our services at no cost, ensuring that families and seniors can benefit from tailored assistance in their search for care and home options. Our ability to offer personalized guidance without charge to families and seniors is made possible through the support and funding from the communities with which we team up.
What services do you offer?
- Finding and ranking the best assisted living facilities
- Finding and ranking the best nursing homes
- Finding and ranking the best memory care facilities
- Our concierge service helps seniors move into the perfect home for them
- Helping seniors use medicare, medicaid, and other government programs to pay for their homes
- Helping seniors avoid senior homes that have bad service or fraud
- Autobiography & Family History Writing + Research
- Senior-focused concierge medicine
- Senior-focused nutritionist
- Senior-focused personal training
- Memory care specialists
- Custom wheelchairs at all price points.
- Custom hearing aids
- Cosmetic skincare + dermatology
- Companionship: We offer in-person and virtual companionship services. Someone engaging to hang out with or talk to on video chat.
- Senior housing concierge. Our service finds the best senior living options based on your needs, income, and personality.

Published on
Updated on
Feedback
